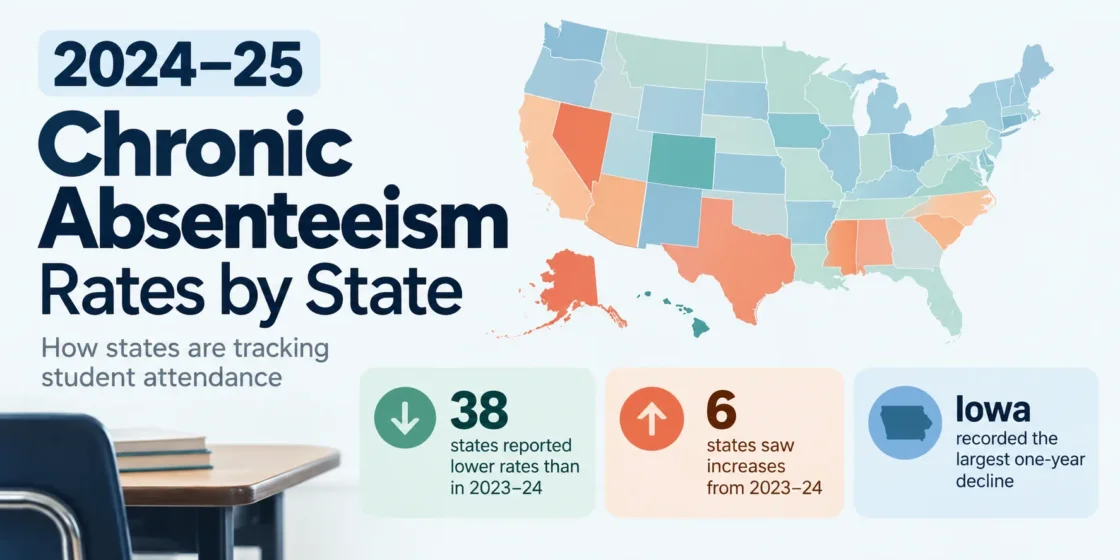
Most states with 2024–25 chronic absenteeism data reported lower rates than in 2023–24, but the pattern was not universal. Iowa recorded the largest one-year decline, while Colorado, Oklahoma, Mississippi, New Mexico, and the District of Columbia moved upward; Mississippi and New Mexico increased by more than three percentage points.1
The reporting universe also differs slightly between national trackers. FutureEd counts 44 states plus D.C. with 2024–25 data, while the Return to Learn Tracker reports data for 45 states and says 38 recorded declines. The state table keeps all 50 states and the District of Columbia visible rather than dropping jurisdictions without a verified 2024–25 figure.12
2024–25 Chronic Absenteeism Rates by State
Chronic absenteeism generally refers to missing at least 10% of enrolled school days, including excused and unexcused absences. State reporting rules are not identical, however. Minimum enrollment periods, grade coverage, denominator rules, and the treatment of partial-day absences can differ. The rates here therefore represent each jurisdiction’s published or otherwise verified 2024–25 measure rather than one federally standardized 51-jurisdiction dataset.2
| State or Jurisdiction | 2024–25 Rate | Reporting Scope or Status |
|---|---|---|
| Alabama | 12.1% | Statewide |
| Alaska | 42.8% | Statewide |
| Arizona | 23.8% | Grades 1–8 in the state-reported series used by the national tracker |
| Arkansas | 28.8% | State-level estimate |
| California3 | 19.4% | Statewide end-of-year, all-grade measure |
| Colorado4 | 28.4% | Statewide; chronic absence is based on at least 10% of days enrolled |
| Connecticut | 17.2% | Statewide |
| Delaware | 17.1% | Statewide |
| District of Columbia | 39.5% | Districtwide public-school measure |
| Florida | — | No verified statewide 2024–25 chronic absenteeism figure located |
| Georgia | 20.4% | Statewide |
| Hawaii | 23.7% | State-level measure |
| Idaho5 | 14.6% | Students enrolled at their base school for at least 10 days |
| Illinois | 25.4% | Statewide |
| Indiana | 16.8% | Statewide cumulative-year measure |
| Iowa | 15.8% | Statewide |
| Kansas | 19.5% | Statewide |
| Kentucky | 25.0% | Statewide |
| Louisiana | 22.5% | Statewide |
| Maine6 | 24.1% | 40,414 of 167,922 students; unrounded state rate 24.07% |
| Maryland | 25.0% | Statewide headline rate, rounded |
| Massachusetts | 18.8% | Statewide |
| Michigan | 27.9% | Statewide |
| Minnesota | — | No verified statewide 2024–25 chronic absenteeism figure located |
| Mississippi | 27.6% | Statewide |
| Missouri | 21.5% | Statewide |
| Montana | — | No verified statewide 2024–25 chronic absenteeism figure located |
| Nebraska | 19.4% | Statewide |
| Nevada | 26.6% | Statewide |
| New Hampshire | — | No verified statewide 2024–25 chronic absenteeism figure located |
| New Jersey7 | 14.4% | Official statewide 2024–25 figure |
| New Mexico8 | 33.0% / 28.9% | PED attendance dashboard / NM Vistas; the two state reporting systems do not produce the same FY25 figure |
| New York | 27.0% | Grades 1–12 accountability population; prekindergarten and kindergarten excluded |
| North Carolina9 | 24.0% | North Carolina DPI data obtained by request; public K–12 students enrolled at least 10 days |
| North Dakota | 20.0% | Statewide |
| Ohio | 25.1% | Statewide |
| Oklahoma | 19.1% | Statewide |
| Oregon10 | 33.5% | Annual state measure based on the reporting period ending in May |
| Pennsylvania | 20.4% | Statewide |
| Rhode Island | 22.1% | Statewide |
| South Carolina | 22.3% | Published state measure |
| South Dakota | 20.3% | Statewide |
| Tennessee | 18.3% | Statewide |
| Texas | 18.0% | Statewide performance-reporting measure |
| Utah | 23.8% | Statewide; reporting population requires enrollment for at least one quarter |
| Vermont | 25.0% | Statewide |
| Virginia | 14.8% | Statewide |
| Washington | 27.1% | Statewide |
| West Virginia | 22.6% | Statewide |
| Wisconsin | 17.3% | Statewide certified data |
| Wyoming | — | No verified statewide 2024–25 chronic absenteeism figure located |
The table should not be treated as a strict best-to-worst attendance ranking. States differ in minimum enrollment periods, included grades, denominator construction, partial-day treatment, and other reporting rules. Return to Learn notes that state measures often require enrollment for a quarter or roughly 100 days, while older EDFacts-based estimates used students enrolled for at least 10 days.2
Among jurisdictions with one displayed rate, the 2024–25 values range from 12.1% in Alabama to 42.8% in Alaska, a spread of 30.7 percentage points.2 New Jersey’s 14.4% figure is an official statewide 2024–25 rate published by NJDOE.7 The numerical range describes the published measures; it does not erase the reporting differences between states.
Where 2024–25 Rates Moved the Most
The broad direction was downward, but the size of the change varied. Iowa’s rate fell 5.8 percentage points in one year, from 21.6% to 15.8%, the largest decline identified in the current state tracking.11
| State or Jurisdiction | 2023–24 | 2024–25 | Change |
|---|---|---|---|
| Iowa11 | 21.6% | 15.8% | −5.8 pp |
| Delaware | 20.5% | 17.1% | −3.4 pp |
| Nevada12 | 29.3% | 26.6% | −2.7 pp |
| Texas13 | 19.0% | 18.0% | −1.0 pp |
| Ohio14 | 25.6% | 25.1% | −0.5 pp |
| Oklahoma15 | 19.0% | 19.1% | +0.1 pp |
| District of Columbia | 39.2% | 39.5% | +0.3 pp |
| Mississippi16 | 24.4% | 27.6% | +3.2 pp |
Return to Learn also places Kentucky among the states with larger 2024–25 improvements; its published 2024–25 rate is 25.0%.2 FutureEd identifies Colorado and New Mexico among the jurisdictions moving upward.1 A single New Mexico percentage-point change is not shown because the state’s two reporting systems publish different FY25 chronic absenteeism figures.8
Lower Than the Pandemic Peak Still Does Not Mean Back to 2018–19
State rates have generally fallen from their pandemic-era highs, but FutureEd reports that no state in its tracker has fully returned to its pre-pandemic chronic absenteeism level. Alabama is the closest, at roughly one percentage point above its earlier baseline.1
A state’s latest rate and its recovery from an earlier baseline answer different questions. California and Virginia illustrate that difference:
12.1% → 30.0% → 19.4%
2018–19 → 2021–22 → 2024–25. The latest rate remains 7.3 percentage points above 2018–19.3
10.6% → 20.1% → 14.8%
2018–19 → 2021–22 → 2024–25. The latest rate remains 4.2 percentage points above 2018–19.17
California’s 19.4% rate is higher than Virginia’s 14.8%, and California also remains farther above its 2018–19 baseline in these two examples. Across the full state table, however, a low current rate does not automatically identify the state that has recovered the most from its own pre-pandemic level.
State Reporting Rules Limit a Strict 1–51 Ranking
Differences in reporting populations can move a chronic absenteeism rate even when the basic 10% threshold looks similar. Return to Learn notes that state eligibility rules commonly require enrollment for a quarter or roughly 100 days, while older federal EDFacts-based estimates used a much shorter enrollment threshold. A state-to-state comparison is therefore cleaner when the reporting population and denominator rules are also known.2
- Arizona’s state-reported 2024–25 figure in the national tracker is labeled for grades 1–8 rather than an all-grade statewide population.2
- Idaho includes students enrolled at their base school for at least 10 days and treats a student as absent for a day when more than half of that school day is missed.5
- North Carolina’s 24.0% statewide value comes from DPI data obtained by request and covers public K–12 students enrolled for at least 10 days.9
- Oregon’s annual attendance reporting is tied to the third reporting period ending in May, which is part of the state’s published measurement structure.10
New Mexico Publishes Two Different FY25 Rates
New Mexico is a clear example of why a single ranking number can be misleading. A Legislative Finance Committee report identifies an FY25 chronic absenteeism rate of 33.0% in the Public Education Department attendance dashboard and 28.9% in NM Vistas. The report states that the two systems do not align in their calculations, and their trend patterns also differ.8
For that reason, both values remain visible in the state table instead of selecting one as though the other did not exist.
California Shows How Population Scope Changes the Number
California’s statewide end-of-year reporting gives an all-grade chronic absenteeism rate of 19.4% for 2024–25.3 The California School Dashboard uses a different chronic absenteeism indicator for transitional kindergarten through grade 8 and reports a 17.1% state result for 2024–25; its eligibility rules also require at least 31 instructional days of enrollment.18
The two California values are not interchangeable. The state table uses 19.4% because an all-grade statewide end-of-year measure is available, while the 17.1% Dashboard figure applies to a narrower grade population.