Virginia’s 2024–25 Chronic Absenteeism Rate Is 14.8%
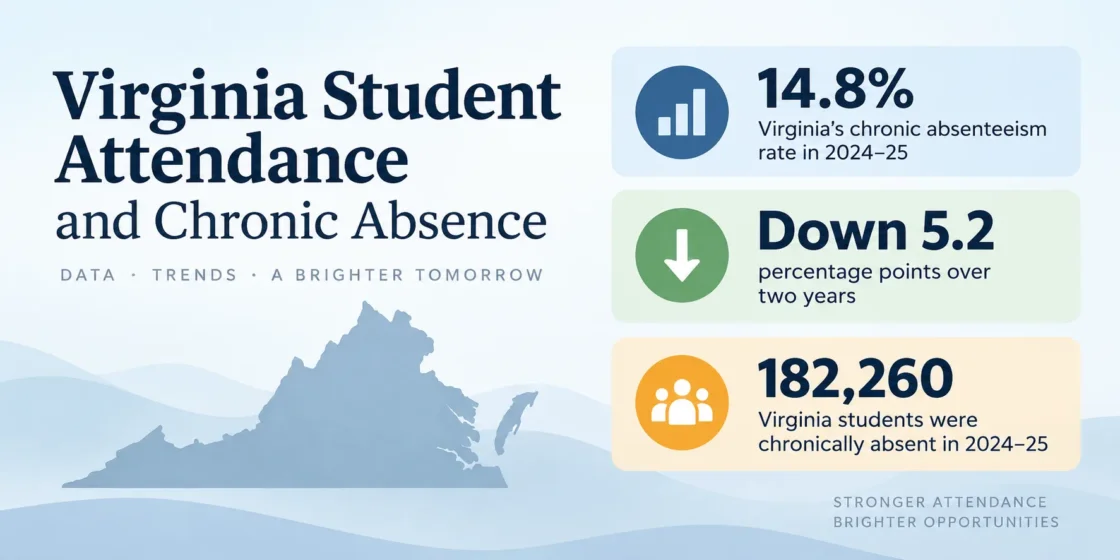
The Virginia Department of Education (VDOE) currently reports a statewide chronic absenteeism rate of 14.8% for 2024–25 after attendance recovery is incorporated. VDOE’s current three-year presentation shows 20.0% in 2022–23, 15.7% in 2023–24 with attendance recovery, and 14.8% in 2024–25 with attendance recovery. That is a 5.2-percentage-point decline over two years, or 26% relative to the 2022–23 rate.
The Virginia School Quality Profiles provide a second view of the same attendance problem through student counts. For 2024–25, the statewide profile places 182,260 students in the “10% or Above” absence category and 1,056,926 below 10%. The count-based share is about 14.7%, which is one-tenth of a point below VDOE’s 14.8% headline figure. The reporting difference is addressed below rather than forcing the two displays into a single number.
The Statewide Rate Has Fallen for Two Consecutive Years
Virginia’s chronic absenteeism rate rose sharply after the pandemic. An earlier VDOE statewide series placed the rate at 10.6% in 2018–19 and 20.1% in 2021–22. VDOE later omitted 2019–20 and 2020–21 from that comparison because the COVID-19 period limited year-to-year comparability.
For the most recent three school years, VDOE now presents attendance recovery separately. That distinction matters because flexible instructional time can change whether a student remains above the chronic-absence threshold.
Rates after attendance recovery where VDOE reports a recovery-adjusted value.
The 2022–23 value is the baseline shown by VDOE. Recovery-adjusted values are shown for 2023–24 and 2024–25.
| School Year | Current Trend Rate | Without Attendance Recovery |
|---|---|---|
| 2022–23 | 20.0% | 20.0% |
| 2023–24 | 15.7% | 16.1% |
| 2024–25 | 14.8% | 15.7% |
VDOE reports that the two-year improvement corresponded with 2,098,669 fewer absent days among K–12 students and 14,690,683 additional hours of instruction. The recovery-adjusted 2024–25 rate is still above the 10.6% pre-pandemic reference from 2018–19, so Virginia has not returned to that earlier level.
Attendance Recovery Changes the 2024–25 Measure
Virginia’s latest rate cannot be interpreted only as a count of ordinary school-day absences. VDOE guidance states that 2024–25 chronic absenteeism data incorporate flexible instructional hours used for attendance recovery. Under the guidance used for that year, a student could earn one day of attendance back for every three hours of recovery time, up to 15 days.
VDOE’s 2025 presentation shows a 2024–25 chronic absenteeism rate of 15.7% without attendance recovery and 14.8% with it. For 2023–24, the same presentation shows 16.1% without recovery and 15.7% with recovery. Comparisons across years should therefore keep the recovery treatment in view.
Virginia Uses a 10% Membership Threshold
VDOE defines a student as chronically absent when days absent equal or exceed 10% of the student’s total days in membership. The reason for the missed time does not remove it from the general chronic-absence definition: VDOE’s attendance guidance includes excused absences, unexcused absences, and suspensions.
For a 180-day school year, 10% is about 18 days, or roughly two to three days per month. The 18-day figure is an example for a full 180-day year, not a separate legal threshold for every student. A student with 150 days in membership reaches 10% at 15 absent days; a student with 100 days in membership reaches it at 10.
VDOE includes a student in a school’s chronic absenteeism calculation when the student’s average daily membership is at least 50% for that school year. The school rate then divides students absent at least 10% of their membership days by the students meeting that membership rule.
The Number Above the 10% Threshold Fell by More Than 66,000
Virginia School Quality Profiles publish statewide counts for students below 10% and at or above 10%. The number in the higher-absence category fell from 248,663 in 2022–23 to 182,260 in 2024–25, a decrease of 66,403 students.
| School Year | Below 10% | 10% or Above | Reporting Population | Calculated Share at 10%+ |
|---|---|---|---|---|
| 2022–23 | 997,671 | 248,663 | 1,246,334 | 20.0% |
| 2023–24 | 1,049,059 | 195,466 | 1,244,525 | 15.7% |
| 2024–25 | 1,056,926 | 182,260 | 1,239,186 | 14.7% |
VDOE’s current attendance page and its statewide attendance presentation use 14.8% as the 2024–25 headline rate. The School Quality Profiles counts shown here produce about 14.7% when the 182,260 students at or above 10% are divided by the listed reporting population. Virginia’s 2025 annual report also uses 14.7% in one statewide passage and 14.8% in its attendance appendix. The public materials do not clearly document the reason for the one-tenth-point difference, so 14.8% is retained as VDOE’s current headline while the count table remains in its published form.
Chronic Absence Remains Concentrated in Several Student Groups
The statewide average masks wide differences among student groups. The rates in the next table are calculated from the 2024–25 “Below 10%” and “10% or Above” counts published in the Virginia School Quality Profiles. They are derived shares, not separately published VDOE subgroup rates.
Share of each listed group in the School Quality Profiles 10%-or-above category.
| Student Group | Below 10% | 10% or Above | Calculated Share |
|---|---|---|---|
| Homeless students | 10,303 | 7,840 | 43.2% |
| Economically disadvantaged | 421,735 | 117,306 | 21.8% |
| Students with disabilities | 144,720 | 37,237 | 20.5% |
| American Indian | 2,637 | 600 | 18.5% |
| Hispanic | 203,741 | 46,281 | 18.5% |
| Black | 216,290 | 47,684 | 18.1% |
| English learners | 160,374 | 34,342 | 17.6% |
| Multiple races | 74,207 | 13,025 | 14.9% |
| White | 470,739 | 63,811 | 11.9% |
| Asian | 87,648 | 10,590 | 10.8% |
Among the groups displayed, homeless students had the highest calculated share at 43.2%. Economically disadvantaged students and students with disabilities were also above 20%. These differences describe the distribution in the state data; the counts alone do not establish why one group has a higher rate than another.
Improvement Reached Every Region, but High School Remains a Pressure Point
Grades 9–12 Remain Above the Statewide Rate
Virginia’s 2025 annual report says every grade span improved in 2024–25. The largest decrease occurred in grades K–2, with almost 3,500 more early-elementary students attending more regularly than in the prior school year. Even after the statewide decline, 18.6% of students in grades 9–12 were still chronically absent.
All Eight Superintendent’s Regions Improved
All eight Virginia Superintendent’s Regions recorded improvement in 2024–25 when division results were combined, and 74% of school divisions reduced chronic absenteeism from the prior year. Over the two-year period reported by VDOE, Title I schools posted a 29.7% reduction, compared with 24.3% for non-Title I schools.
Chronically Absent Students Had Lower 2023–24 SOL Performance
VDOE’s 2023–24 results show a clear performance gap between chronically absent students and students who attended more regularly. The reported differences were measured in percentage points, not as a claim that absence alone caused the entire gap.
19 percentage points lower
Chronically absent students compared with their peers in 2023–24.
26 percentage points lower
Chronically absent students compared with their peers in 2023–24.
Chronic Absence and Virginia’s Nonattendance Process Are Separate Measures
Chronic absenteeism is an attendance-data measure based on the share of enrolled days missed. Virginia’s truancy and nonattendance process focuses on different conditions, including whether an absence is unexcused and whether the parent is aware of and supports the absence.
Under Code of Virginia § 22.1-258, when a pupil has missed a total of five scheduled school days and the statute’s parent-awareness and notification conditions are met, the school must make a reasonable effort for direct contact and develop a plan with the parent and student to resolve the nonattendance. If the pupil is absent for more than one additional day under the same conditions after direct contact, the principal or designee must schedule a conference. These steps belong to the statutory nonattendance process; they do not replace the separate 10% chronic-absence measure.
An individual student’s official attendance record, absence classification, recovery credit, and any school response depend on the records and rules applied by the student’s school division.