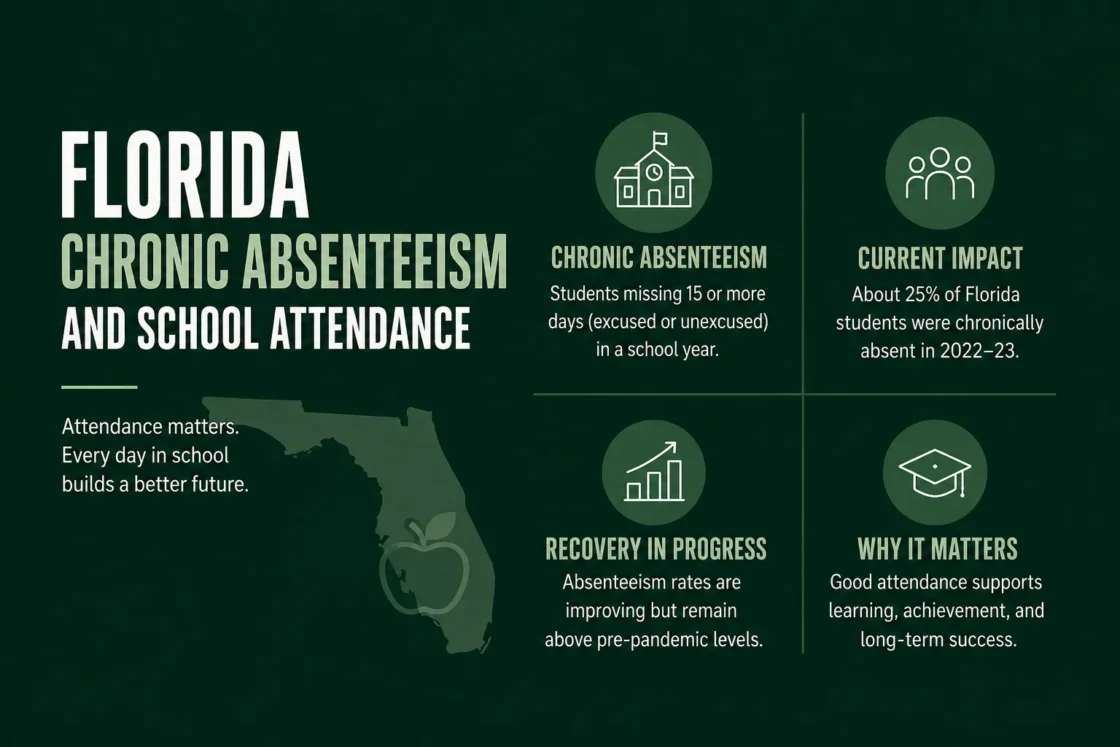
Florida reports chronic absenteeism separately from average school attendance. On Florida Report Cards, a K–12 student is considered chronically absent when the student was enrolled at a school for at least 10 school days and was absent for 10% or more of the school days at that school.1 Florida also publishes Average Daily Attendance and Average Daily Membership data, including district- and school-level files for 2024–25.2
How Florida Counts Chronic Absenteeism
Florida Report Cards use final end-of-year Survey 5 data submitted by public school districts. The chronic absenteeism measure covers students in kindergarten through grade 12. A student must have been enrolled in a particular school for at least 10 school days before that school is included in the calculation.1
A K–12 student meets the chronic absenteeism definition when the student is enrolled at a school for at least 10 school days and misses 10% or more of the school days at that school.
The percentage is based on days enrolled rather than a fixed number of missed days. For example, 18 absences would equal 10% of a 180-day enrollment, while a student enrolled for fewer days could reach the threshold with fewer absences.
Florida also applies a specific aggregation rule. State and district figures on the Report Cards are built from school-level records. If a student attends multiple schools or districts during the same year, that student can appear more than once in the aggregated data. FDOE notes that this can produce differences from reports that count each student only once.1
Florida Student Nonattendance Trend
A separate FDOE student nonattendance series shows how the share of students meeting two absence thresholds changed from 2019–20 through 2023–24. The presentation identifies one measure as 21 or more days absent and the other as 10% or more days absent. Its footnote states that the percentages represent average percentages of students with unexcused absences.3
Statewide total percentages reported in the FDOE student nonattendance series.
These figures come from FDOE’s student nonattendance presentation and should not be treated as interchangeable with the Report Card chronic absenteeism metric.3
| School Year | Absent 21+ Days | Absent 10% or More |
|---|---|---|
| 2019–20 | 9.8% | 16.6% |
| 2020–21 | 16.6% | 25.1% |
| 2021–22 | 20.9% | 32.3% |
| 2022–23 | 19.4% | 30.9% |
| 2023–24 | 19.9% | 31.4% |
The 10%-or-more series rose from 16.6% in 2019–20 to 32.3% in 2021–22. It then remained near 31%, with 30.9% in 2022–23 and 31.4% in 2023–24. The 21-or-more-days measure followed a similar pattern but stayed lower throughout the five-year period.
The trend table is an FDOE student nonattendance series whose footnote refers to unexcused absences. Florida Report Card chronic absenteeism uses a different definition that counts a student after missing 10% or more of enrolled school days. Comparing percentages is most reliable when the source, population and calculation method remain the same.13
Two Florida Attendance Measures
Student-level threshold
Florida Report Cards identify K–12 students who miss at least 10% of their enrolled school days after meeting the minimum enrollment rule.
Average attendance measure
ADA measures the average number of students present each day. ADM measures the average number on the current roll each day school is in session.
FDOE defines Average Daily Attendance as aggregate days of attendance divided by the number of days school was in session. Average Daily Membership uses aggregate days of membership divided by the number of school days. Florida publishes these figures by district and by school.2
These measures answer different questions. An average attendance measure describes attendance across a school or district, while chronic absenteeism identifies students whose individual absence rate crosses a threshold. A school can therefore have a fairly high average attendance level while still having a sizable group of students who miss 10% or more of their enrolled days.
The 90% Attendance Threshold in K–8 Schools
Florida’s school early-warning requirements use another attendance threshold. Schools serving students in kindergarten through grade 8 must include attendance below 90% as an early-warning indicator, whether the absence is excused or results from an out-of-school suspension.4
Missing 10% of enrolled days and attending less than 90% of days are mathematically related, but the two rules serve different purposes. Chronic absenteeism is used as an attendance reporting measure. The K–8 threshold is an early-warning indicator used to identify students who may need support.
Chronic absence also should not be read as another name for truancy. FDOE distinguishes the terms by noting that truancy focuses on unexcused absences, while chronic absence counts excused absences, unexcused absences and suspensions.3
District, School, and Subgroup Attendance Data
Florida Report Cards provide chronic absenteeism data that can be viewed by subgroup. FDOE suppresses a subgroup when fewer than 10 students are included across its categories, so some small-school or small-subgroup values may not appear.1
For broader school-attendance comparisons, FDOE’s attendance publications provide Average Daily Attendance and Average Daily Membership files at both district and school level for 2024–25.2 When comparing a district, school or student group with a statewide figure, the metric and reporting scope should match; an ADA/ADM measure, a Report Card chronic absenteeism percentage and an unexcused-nonattendance percentage are not substitutes for one another.