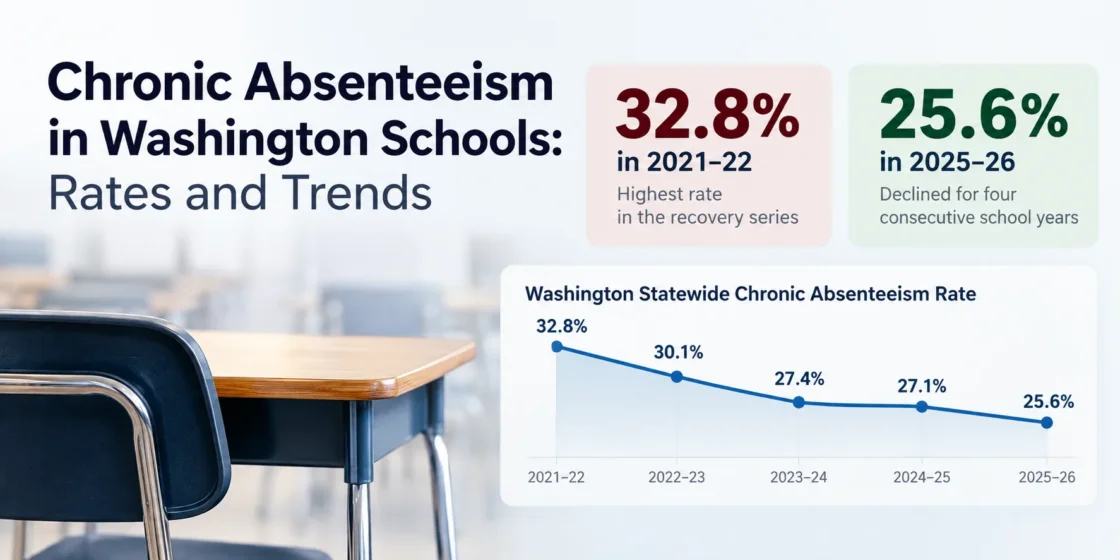
Washington’s latest statewide data indicate a 25.6% chronic absenteeism rate in 2025–26. The Office of Superintendent of Public Instruction reported 800,833 regularly attending students out of 1,076,416 students represented in the statewide measure. Using Washington’s chronic-absence threshold, the difference corresponds to 275,583 chronically absent students. The dataset is dated September 10, 2026.12
Washington’s Statewide Chronic Absenteeism Trend
Chronic absenteeism has fallen for four consecutive school years since the 2021–22 high. Washington’s regular attendance rate was 67.2% in 2021–22, which corresponds to 32.8% chronic absenteeism. By 2025–26, chronic absenteeism had declined to 25.6%.
Washington statewide, 2021–22 through 2025–26
Chronic absenteeism is calculated as 100% minus the statewide regular attendance rate. The 2022–23 through 2024–25 values use OSPI’s March 2026 attendance measure; 2021–22 comes from OSPI’s statewide progress-monitoring series; 2025–26 uses the September 2026 Report Card dataset.341
| School Year | Regular Attendance | Chronic Absenteeism | Context |
|---|---|---|---|
| 2018–19 | 84.9% | 15.1% | Pre-pandemic benchmark4 |
| 2021–22 | 67.2% | 32.8% | Highest rate in the recovery series4 |
| 2022–23 | 69.9% | 30.1% | Down 2.7 percentage points3 |
| 2023–24 | 72.6% | 27.4% | Down 2.7 percentage points3 |
| 2024–25 | 72.9% | 27.1% | Down 0.3 percentage points3 |
| 2025–26 | 74.4% | 25.6% | Down 1.5 percentage points1 |
From 2021–22 to 2025–26, the statewide chronic absenteeism rate fell by 7.2 percentage points, equal to a roughly 22% relative decline. The latest rate nevertheless remains 10.5 percentage points above the 15.1% level calculated for 2018–19.
The recovery chart begins with 2021–22. The 2018–19 rate is kept as a separate pre-pandemic benchmark rather than connecting it directly to the post-pandemic series.
Chronic Absenteeism by Grade in 2025–26
The latest state data show a clear grade pattern. Chronic absenteeism is lowest in the early elementary grades, reaches its minimum in grade 3, and then rises through middle and high school. Grade 12 has the highest K–12 rate in the statewide dataset.1
| Grade | Regular Attendance | Chronic Absenteeism |
|---|---|---|
| Kindergarten | 75.3% | 24.7% |
| 1 | 78.6% | 21.4% |
| 2 | 80.4% | 19.6% |
| 3 | 81.5% | 18.5% |
| 4 | 80.8% | 19.2% |
| 5 | 80.6% | 19.4% |
| 6 | 78.4% | 21.6% |
| 7 | 75.5% | 24.5% |
| 8 | 72.5% | 27.5% |
| 9 | 71.3% | 28.7% |
| 10 | 68.2% | 31.8% |
| 11 | 65.6% | 34.4% |
| 12 | 63.3% | 36.7% |
The gap between grade 3 and grade 12 is 18.2 percentage points. The pattern is not simply an elementary-versus-secondary split: the rate begins rising after grade 5 and exceeds the statewide 25.6% rate by grade 8.
Rates Across Student Groups
Washington’s Report Card also disaggregates regular attendance by student characteristics. The table uses the same 2025–26 statewide dataset and converts regular attendance to chronic absenteeism. The student counts are calculated by subtracting the regular-attendance numerator from the measure denominator.1
| Student Group | Regular Attendance | Chronic Absenteeism | Calculated Chronically Absent Count |
|---|---|---|---|
| All students | 74.4% | 25.6% | 275,583 |
| Non-low income | 82.2% | 17.8% | 98,584 |
| Low income | 66.2% | 33.8% | 176,999 |
| English language learners | 68.4% | 31.6% | 53,240 |
| Students with disabilities | 67.5% | 32.5% | 57,475 |
| American Indian/Alaskan Native | 56.3% | 43.7% | 5,387 |
| Homeless | 49.7% | 50.3% | 20,470 |
Low-income students had a chronic absenteeism rate 16.0 percentage points higher than non-low-income students in 2025–26. Students identified as homeless had the highest rate among the groups shown, with about half meeting the chronic-absence threshold. These categories are not mutually exclusive, so the student counts must not be added together.
How Washington Measures Chronic Absence
Washington defines a student as chronically absent when the student misses 10% or more of school days, which is about 18 days in a typical school year. The measure includes both excused and unexcused absences.2
OSPI reports the related metric as regular attendance. A student is considered regularly attending when the student averages fewer than two absences per month; in a typical school year, that generally means missing 17 days or fewer.3 For statewide data presented as regular attendance, the chronic absenteeism percentages on this page are the complementary rates: 100% minus the regular attendance percentage.
Chronic absenteeism counts missed instructional time regardless of whether an absence is excused or unexcused. Truancy is tied to unexcused absences and Washington attendance requirements. A chronic absenteeism rate therefore should not be read as a truancy rate.
Washington’s 2029 Reduction Goal
OSPI has joined a five-year effort to reduce Washington’s chronic absenteeism rate from about 27% to 14% by 2029. The state challenge uses 2023–24 as its baseline period and reports a 27.1% actual rate for 2024–25.2
The newer 2025–26 Report Card data place the statewide rate at 25.6%. That is 1.5 percentage points below 2024–25 and 7.2 points below 2021–22, but it remains 11.6 percentage points above the state’s 14% five-year target.1