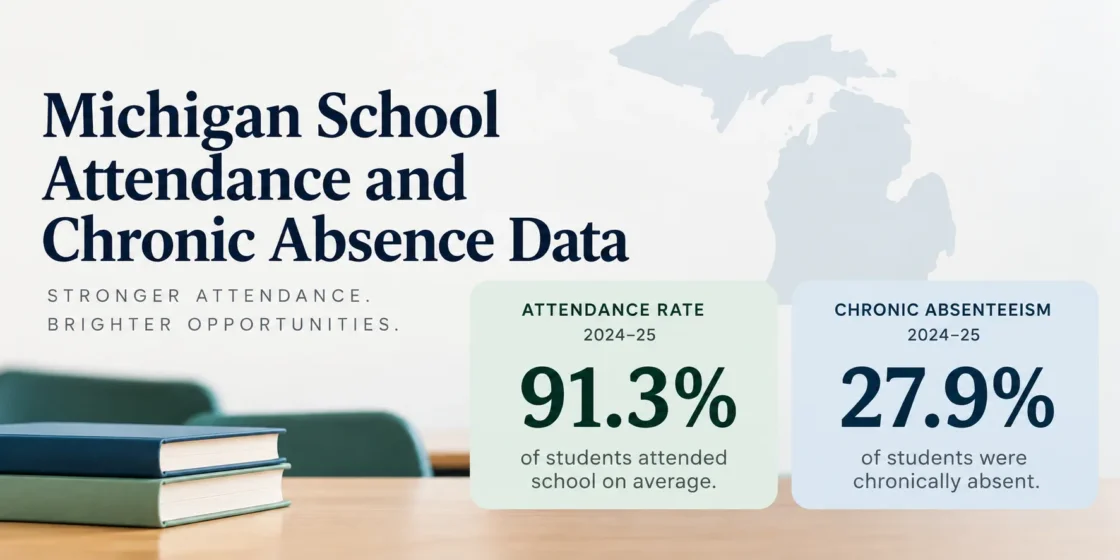
Michigan’s latest publicly released statewide attendance data show a 91.3% attendance rate for 2024–25 and a 27.9% chronic absenteeism rate. A total of 387,934 students met the state reporting definition of chronically absent, 25,147 fewer students than in the previous school year. Michigan has now recorded three consecutive years of improvement in both statewide attendance and chronic absenteeism.
MI School Data lists the 2025–26 Student Attendance update in preview rather than as a public release. The statewide figures on this page therefore use 2024–25, the latest publicly available Michigan Student Attendance dataset. The release status is published on the MI School Data recently posted reports page.
Michigan Attendance and Chronic Absence Trend
Michigan’s statewide chronic absenteeism rate rose sharply after 2020–21, reaching 38.6% in 2021–22. It has fallen in every school year since then: 30.8% in 2022–23, 29.5% in 2023–24 and 27.9% in 2024–25.
Percent of students meeting Michigan’s reported chronic-absence definition for each school year.
The year-by-year series is reported in the Michigan Department of Education and CEPI attendance presentation.
| School Year | Chronic Absenteeism Rate |
|---|---|
| 2015–16 | 14.8% |
| 2016–17 | 15.5% |
| 2017–18 | 19.8% |
| 2018–19 | 19.6% |
| 2019–20 | 20.1% |
| 2020–21 | 19.8% |
| 2021–22 | 38.6% |
| 2022–23 | 30.8% |
| 2023–24 | 29.5% |
| 2024–25 | 27.9% |
The 2024–25 rate was 10.7 percentage points below the 2021–22 peak. The recovery is not complete, however. The latest 27.9% rate remained 8.3 percentage points above the 19.6% reported in 2018–19.
Average attendance has moved in the opposite direction. Michigan’s statewide attendance rate rose from 88.8% in 2021–22 to 91.3% in 2024–25, a gain of 2.5 percentage points. The latest values are also used in the Michigan Department of Education’s Student Attendance and Engagement Guidance.
| School Year | Attendance Rate |
|---|---|
| 2021–22 | 88.8% |
| 2022–23 | 90.5% |
| 2023–24 | 90.8% |
| 2024–25 | 91.3% |
Why 91.3% Attendance and 27.9% Chronic Absence Can Both Be True
The two percentages measure different parts of attendance. Michigan calculates the overall attendance rate from the total days students attended divided by their total possible attendance days. Chronic absenteeism instead measures the share of individual students whose missed days cross the chronic-absence threshold.
Days-based measure
Total reported days attended divided by total possible attendance days.
Student-based measure
The share of qualifying students who miss at least 10% of their possible school days.
A statewide attendance rate of 91.3% does not mean that 8.7% of students were chronically absent. Many students can attend most school days while a much larger share of individual students still accumulates enough absences to cross the 10% threshold. The measures should therefore be compared as separate indicators rather than treated as complementary percentages.
How Michigan Counts a Chronically Absent Student
For school years 2015–16 and later in the Student Attendance report, a student is chronically absent when the student misses 10% or more of possible days during the scheduled school year and was enrolled in a district or building for at least 10 consecutive days.
The threshold depends on the number of possible attendance days for the student rather than one fixed statewide number of absences. A student with 180 possible days would reach 10% at 18 missed days, while a student with fewer possible days can reach the threshold with fewer absences.
MI School Data also states that the Student Attendance dataset does not distinguish between excused and unexcused absences. The statewide chronic absenteeism figures should not be read as Michigan truancy rates. The definitions, reporting population and calculation rules are documented in the official MI School Data Student Attendance report.
2024–25 Chronic Absenteeism Across Michigan Student Groups
The statewide 27.9% rate does not describe every student group equally. Michigan’s 2024–25 data show the highest rate among the major status groups reported in the state presentation for students experiencing homelessness, followed by students experiencing foster care and economically disadvantaged students.
Selected statewide groups reported by Michigan Department of Education and CEPI.
Rates come from the statewide CEPI attendance analysis presented to the Michigan State Board of Education.
| Student Group | Group Rate | Comparison Group | Comparison Rate | Gap |
|---|---|---|---|---|
| All Students | 27.9% | — | — | — |
| Students Experiencing Homelessness | 57.4% | Students Not Experiencing Homelessness | 27.1% | +30.3 pp |
| Students Experiencing Foster Care | 42.5% | Students Not Experiencing Foster Care | 27.8% | +14.7 pp |
| Economically Disadvantaged | 38.6% | Not Economically Disadvantaged | 15.8% | +22.8 pp |
| Students With Disabilities | 35.8% | Students Without Disabilities | 26.4% | +9.4 pp |
| English Learners | 30.7% | Not English Learners | 27.7% | +3.0 pp |
The largest paired difference in this set was associated with homelessness status: 57.4% of students experiencing homelessness were chronically absent compared with 27.1% of students not reported as homeless, a difference of 30.3 percentage points.
Economic status also shows a wide separation. Chronic absenteeism was 38.6% among economically disadvantaged students and 15.8% among students not classified as economically disadvantaged. Both groups improved from 2022–23 through 2024–25, but the 2024–25 difference remained 22.8 percentage points.
Chronic Absenteeism by Race and Ethnicity
Michigan’s CEPI analysis also reports chronic absenteeism by race and ethnicity. Each of the listed groups had a lower rate in 2024–25 than in 2022–23, although the statewide pattern remained uneven.
| Race or Ethnicity | 2022–23 | 2023–24 | 2024–25 |
|---|---|---|---|
| African American | 53.0% | 51.6% | 48.2% |
| American Indian | 37.9% | 36.4% | 34.4% |
| Hispanic of Any Race | 36.1% | 34.7% | 34.0% |
| Two or More Races | 36.2% | 34.4% | 32.3% |
| Native Hawaiian | 32.9% | 33.3% | 30.9% |
| White | 23.8% | 22.4% | 21.1% |
| Asian | 22.6% | 21.3% | 20.0% |
The African American student rate declined from 53.0% in 2022–23 to 48.2% in 2024–25, a 4.8-percentage-point decrease. Over the same period, rates also fell for American Indian, Asian, Hispanic, Native Hawaiian, multiracial and White students. These figures describe reported attendance outcomes; the data alone do not establish why the differences between groups exist.
Reporting Changes That Affect Long-Term Comparisons
Michigan’s public attendance series contains several reporting changes. The chronic absenteeism chart on this page begins with 2015–16 because MI School Data applies the current percentage-based chronic-absence definition from that school year forward. Earlier years used a different definition based on a fixed number of absences.
Percentage-based chronic absence series begins
MI School Data reports students as chronically absent when they miss at least 10% of possible days and meet the minimum enrollment rule. Earlier years used a fixed threshold of 10 or more absences.
Daily absence rule changes
Before 2017–18, a student was counted absent only after missing a full school day. Beginning in 2017–18, missing more than 50% of the school day could count as an absence.
Remote-learning attendance rules apply
During extended COVID-19 learning plans, Michigan permitted attendance to be recorded through two-way online interactions. Two qualifying interactions during a week could count as five attendance days.
Shared-time reporting methodology is revised
Student records in shared-time schools are now deduplicated. The record with the highest days attended and days possible is used, and reporting reflects the operating district rather than the shared district.
The 2024–25 change was introduced to align state and federal reporting and address multiple records for shared-time students. Long-term direction remains useful, but small year-to-year differences around the methodology change should not automatically be treated as changes caused only by student attendance behavior.
MI School Data also applies disclosure rules when a selected group would contain fewer than 10 students. Related groups can be suppressed as well when necessary to protect student privacy. These rules can affect what is visible for small schools, districts and demographic groups.
School and District Attendance Data in Michigan
Michigan’s statewide rate is a benchmark, not an expected value for every local school. The official Student Attendance report supports views for the state, intermediate school districts, districts and schools, with available filters for school year, grade level and demographic groups.
Local comparisons are most useful when the school year, population and metric stay the same. A district chronic absenteeism rate should be compared with the statewide chronic absenteeism rate for the same reporting year rather than with Michigan’s overall attendance rate. The same rule applies when comparing schools or student groups: attendance rate and chronic absenteeism answer different questions even when both are expressed as percentages.
Michigan reports attendance from the Michigan Student Data System using total days attended and total possible attendance submitted for students. Because enrollment duration, suppression rules and the 2024–25 shared-time methodology can affect the published population, the reporting context should remain attached to any school or district comparison.