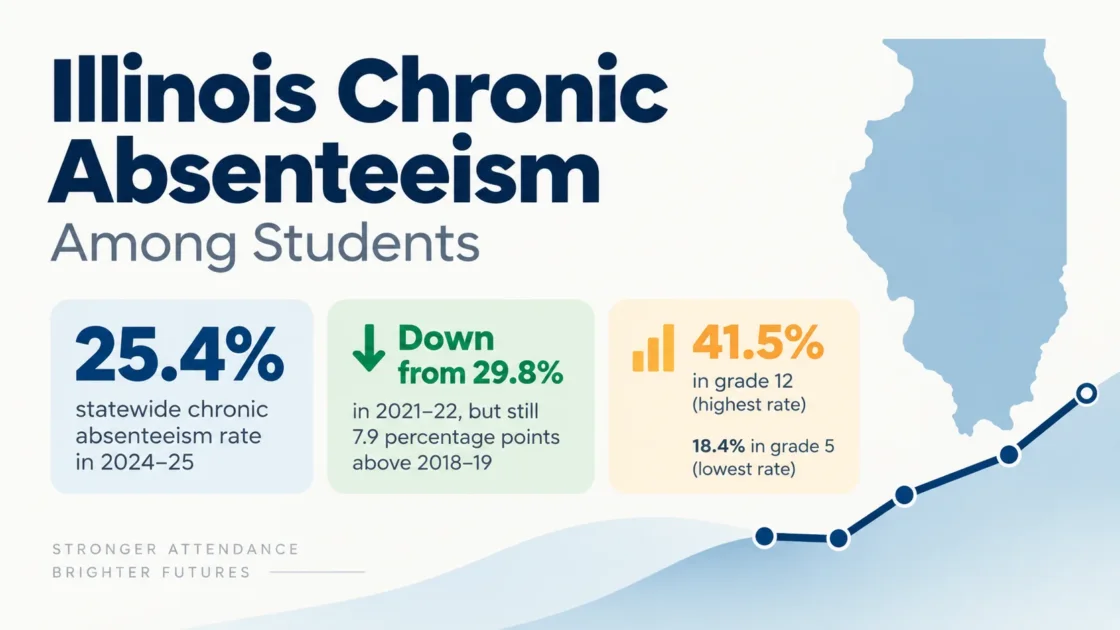
Illinois’ statewide chronic absenteeism rate was 25.4% in the 2024–25 school year, according to the 2025 Illinois Report Card. The rate fell from 26.3% in 2023–24 and from the 29.8% peak in 2021–22, but it remained 7.9 percentage points above the 17.5% recorded in 2018–19. The same statewide data show a wide grade-level spread, from 18.4% in grade 5 to 41.5% in grade 12.
The ISBE Report Card Data Library lists the 2025 Report Card Public Data Set as the newest complete public dataset. Its 2026 Report Card section currently lists a glossary but not a 2026 public data set, so 2024–25 remains the newest complete school-year rate available for statewide analysis.
Illinois Chronic Absenteeism Fell to 25.4% in 2024–25
The statewide rate has declined for three consecutive school years since reaching 29.8% in 2021–22. The drop from that peak to 25.4% in 2024–25 equals 4.4 percentage points. The most recent one-year decline was 0.9 percentage points, compared with declines of 1.5 points in 2022–23 and 2.0 points in 2023–24.
Statewide chronic absenteeism rate.
ISBE reports the earlier trend as Report Card years 2018 through 2024; the labels here show the corresponding academic school years. The 2024–25 value comes from the 2025 Illinois Report Card.
| School Year | Chronic Absenteeism Rate | Change From Prior Year |
|---|---|---|
| 2017–18 | 16.8% | — |
| 2018–19 | 17.5% | +0.7 pp |
| 2019–20 | 11.0% | −6.5 pp |
| 2020–21 | 21.1% | +10.1 pp |
| 2021–22 | 29.8% | +8.7 pp |
| 2022–23 | 28.3% | −1.5 pp |
| 2023–24 | 26.3% | −2.0 pp |
| 2024–25 | 25.4% | −0.9 pp |
ISBE says the drop to 11.0% in 2020 was likely affected by the COVID-19 period and changes in attendance tracking during remote learning. The 11.0% figure does not represent a normal year-to-year improvement under comparable attendance conditions.
The 2024–25 rate is 14.8% lower than the 2021–22 peak on a relative basis, yet it is still 7.9 percentage points above the 2018–19 pre-pandemic reference rate.
Absenteeism Reaches Its Low Point in Grade 5, Then Rises Through Grade 12
Illinois does not show one flat attendance pattern across K–12. The rate starts at 26.1% in kindergarten, falls through the elementary grades to 18.4% in grade 5, and then rises in every grade from grade 6 through grade 12. The increase becomes especially pronounced in high school.
Illinois statewide rate for kindergarten through grade 12.
Statewide grade-level values from the 2025 Illinois Report Card.
| Grade | Rate | Difference From Statewide Rate |
|---|---|---|
| Kindergarten | 26.1% | +0.7 pp |
| Grade 1 | 21.9% | −3.5 pp |
| Grade 2 | 20.2% | −5.2 pp |
| Grade 3 | 19.1% | −6.3 pp |
| Grade 4 | 18.6% | −6.8 pp |
| Grade 5 | 18.4% | −7.0 pp |
| Grade 6 | 20.2% | −5.2 pp |
| Grade 7 | 22.4% | −3.0 pp |
| Grade 8 | 24.2% | −1.2 pp |
| Grade 9 | 28.5% | +3.1 pp |
| Grade 10 | 32.4% | +7.0 pp |
| Grade 11 | 35.1% | +9.7 pp |
| Grade 12 | 41.5% | +16.1 pp |
The grade 12 rate is 23.1 percentage points higher than the grade 5 rate and is about 2.3 times as high. After the grade 5 low point, rates remain below the statewide 25.4% level through grade 8; grade 9 rises above it at 28.5%.
Rates Differ Sharply Across Illinois Student Groups
The statewide average hides larger differences among student groups. Illinois publishes chronic absenteeism by race and ethnicity, disability status, English learner status, housing status, low-income status, military status, Youth in Care status, IEP status, and gender in the 2025 Report Card.
Race and Ethnicity
| Student Group | Rate | Difference From 25.4% State Rate |
|---|---|---|
| American Indian | 33.0% | +7.6 pp |
| Asian | 16.7% | −8.7 pp |
| Black | 39.3% | +13.9 pp |
| Hispanic | 31.7% | +6.3 pp |
| Middle Eastern or North African (MENA) | 21.2% | −4.2 pp |
| Native Hawaiian/Pacific Islander | 26.3% | +0.9 pp |
| Two or More Races | 25.5% | +0.1 pp |
| White | 17.3% | −8.1 pp |
Among the published race and ethnicity categories, the Black student rate was highest at 39.3%, 13.9 percentage points above the statewide rate. The Asian rate was lowest at 16.7%, 8.7 points below the statewide rate. These are descriptive differences in the Report Card data; the rates alone do not establish why the gaps exist.
Housing, Income, Language, and Education Groups
| Student Group | Rate | Difference From 25.4% State Rate |
|---|---|---|
| English Learners | 31.4% | +6.0 pp |
| Homeless | 52.9% | +27.5 pp |
| Students with IEPs | 32.6% | +7.2 pp |
| Low Income | 35.1% | +9.7 pp |
| Military | 20.7% | −4.7 pp |
| Youth in Care | 36.9% | +11.5 pp |
| Students with Disabilities | 31.3% | +5.9 pp |
The largest gap in these published categories is for students reported as homeless: 52.9%, or 27.5 percentage points above the statewide rate. Youth in Care were at 36.9%, low-income students at 35.1%, students with IEPs at 32.6%, English learners at 31.4%, and students with disabilities at 31.3%. ISBE displays Students with IEPs and Students with Disabilities as separate Report Card fields, with a distinct rate reported for each.
The program and student-characteristic categories are not mutually exclusive. A student may belong to more than one group, so adding or averaging these percentages would not reproduce the statewide rate.
Gender Differences Are Smaller Than Several Other Gaps
Illinois reported a 2024–25 chronic absenteeism rate of 25.7% for female students, 25.1% for male students, and 33.1% for non-binary students. The female-male difference was only 0.6 percentage points, much smaller than the 23.1-point difference between grades 5 and 12 or the 27.5-point gap between the homeless subgroup and the statewide rate.
Illinois Uses a 10% Threshold, Not a Fixed Number of Days
Under 105 ILCS 5/26-18, chronic absence means absences totaling 10% or more of school days in the most recent academic school year. The definition includes absences with and without valid cause and out-of-school suspensions for an enrolled student. A student with a documented homebound or hospital record on file during the absence is excluded from the statutory student definition for chronic absence.
For Illinois Report Card reporting, ISBE compares a student’s combined excused and unexcused absences with that student’s length of enrollment. The ISBE attendance metric documentation classifies the student as chronically absent when that ratio is at least 0.10. The familiar 18-day example applies to a 180-day enrollment period; a shorter enrollment period produces a lower numeric cutoff under the same 10% rule.
| School or Enrollment Days | 10% of Days |
|---|---|
| 180 days | 18 days |
| 150 days | 15 days |
| 100 days | 10 days |
The same ISBE reporting documentation defines the statewide or school-level rate as chronically absent students divided by the applicable student population. Medically homebound and hospitalized students are excluded from the calculation.
Chronic Absence and Chronic Truancy Use Different Rules
Illinois chronic absenteeism and chronic truancy are related attendance measures, but they do not classify students the same way. Chronic absence measures total missed school time, while chronic or habitual truancy is tied to absences without valid cause.
| Measure | Threshold | Which Absences Count |
|---|---|---|
| Chronic absence | 10% or more of school days in the most recent academic school year | Absences with valid cause, absences without valid cause, and out-of-school suspensions under 105 ILCS 5/26-18 |
| Chronic or habitual truancy | 5% or more of the previous 180 regular attendance days | Absences without valid cause under 105 ILCS 5/26-2a |
A student may meet the chronic absence threshold even when the absences are excused, provided the student falls within the reporting population and the total reaches the required share of school days. Chronic or habitual truancy uses a different test: it is based on absences without valid cause reaching 5% or more of the previous 180 regular attendance days.
Illinois’ Submitted Accountability Design Uses Consistent Attendance
ISBE has submitted Amendment V to the U.S. Department of Education as part of a redesign of Illinois’ school accountability system. The current ISBE accountability materials list Consistent Attendance as an elevating indicator alongside English learner progress and the climate survey.
ISBE states that strong performance on an elevating indicator can raise a school’s designation but cannot lower it. The submitted redesign changes how attendance is presented in accountability; the statutory chronic absence definition and the Report Card’s chronic absenteeism data remain separate measures.
105 ILCS 5/26-20, effective September 1, 2025, created the Chronic Absence Task Force within ISBE. Its charge includes recommending a statewide strategy, reduction goals, attendance-related policy changes, prevention initiatives, and evidence-based practices. The task force must submit its report to the General Assembly and ISBE by December 15, 2027.