Massachusetts Chronic Absenteeism in 2025–26
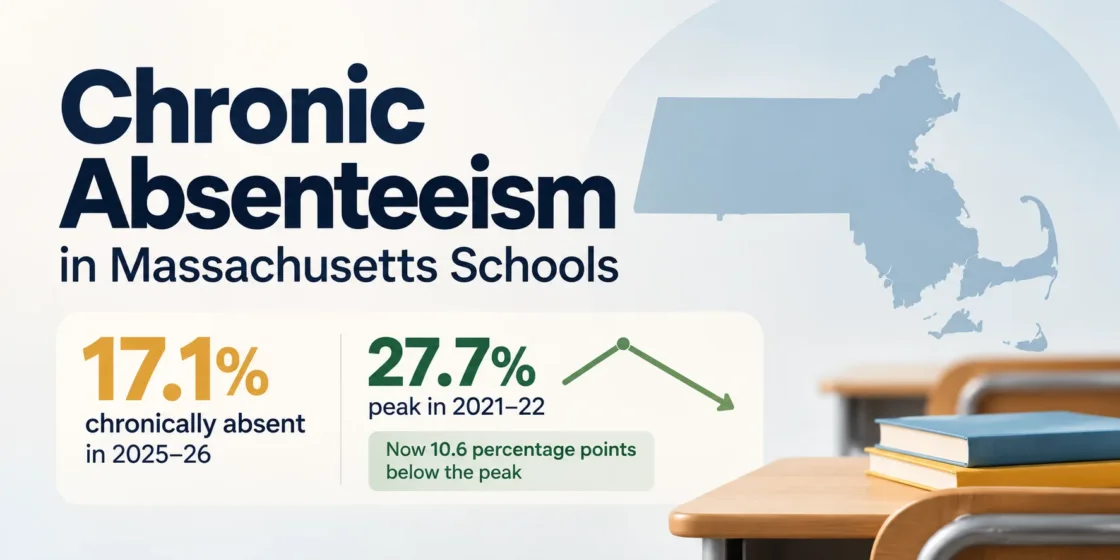
Massachusetts reported a statewide chronic absenteeism rate of 17.1% in 2025–26, down from 18.8% in 2024–25. The statewide attendance rate was 93.6%, and students averaged 11.3 absences during the school year. These figures come from the end-of-year Massachusetts DESE School and District Profiles attendance report.
The latest rate continues the decline from the post-pandemic peak. Chronic absenteeism reached 27.7% in 2021–22, then fell to 22.2% in 2022–23, 19.7% in 2023–24, 18.8% in 2024–25, and 17.1% in 2025–26. The current rate is 10.6 percentage points below the 2021–22 peak, but it remains 4.2 points above the 12.9% recorded in 2018–19.
Massachusetts counts a student as chronically absent when the student misses at least 10% of the days in which they are enrolled. In a 180-day school year, that is about 18 missed days. The measure counts absences regardless of the reason.
Statewide Trend Since 2018–19
Percent of students chronically absent in statewide DESE attendance reporting.
The 2019–20 value is not plotted because Massachusetts reported attendance only through March 2, 2020 rather than through the end of the school year.
| School Year | Attendance Rate | Average Absences | Chronically Absent | Reporting Scope |
|---|---|---|---|---|
| 2018–19 | 94.6% | 9.6 | 12.9% | Full school year |
| 2019–20 | 94.7% | 5.7 | 13.0% | Through March 2, 2020 |
| 2020–21 | 93.7% | 10.6 | 17.7% | End of year; pandemic-affected reporting period |
| 2021–22 | 91.5% | 14.8 | 27.7% | Full school year |
| 2022–23 | 92.5% | 13.1 | 22.2% | Full school year |
| 2023–24 | 93.0% | 12.3 | 19.7% | Full school year |
| 2024–25 | 93.2% | 11.9 | 18.8% | Full school year |
| 2025–26 | 93.6% | 11.3 | 17.1% | Full school year |
The series shows two distinct movements. The statewide rate rose from 12.9% in 2018–19 to 27.7% in 2021–22. It has declined in every completed school year since that peak. From 2022–23 to 2025–26 alone, the rate fell by 5.1 percentage points.
The 2019–20 figure needs separate treatment. Massachusetts stopped that year’s attendance reporting period on March 2, 2020, so its 13.0% rate is not an end-of-year measure comparable with the surrounding full-year figures. DESE also cautions that 2020–21 attendance data may have been affected by pandemic-era schooling conditions.
2025–26 Rates by Student Group
The statewide average masks wide differences among student groups. In the 2025–26 end-of-year report, Hispanic or Latino students and low-income students each had a chronic absenteeism rate of 27.3%. English learners were at 25.4%, students with disabilities at 24.8%, and high-needs students at 24.1%. Asian students had the lowest listed statewide rate at 9.6%.
| Student Group | Attendance Rate | Average Absences | Chronically Absent 10%+ | Chronically Absent 20%+ |
|---|---|---|---|---|
| All Students | 93.6% | 11.3 | 17.1% | 4.8% |
| American Indian or Alaska Native | 91.8% | 14.2 | 24.9% | 8.2% |
| Asian | 95.5% | 7.9 | 9.6% | 1.9% |
| Black or African American | 93.3% | 11.6 | 19.4% | 6.2% |
| Hispanic or Latino | 91.5% | 14.8 | 27.3% | 8.5% |
| Multi-Race, Not Hispanic or Latino | 93.6% | 11.4 | 17.3% | 5.0% |
| Native Hawaiian or Other Pacific Islander | 93.1% | 12.0 | 20.1% | 6.3% |
| White | 94.5% | 9.8 | 12.4% | 3.0% |
| High Needs | 92.2% | 13.6 | 24.1% | 7.4% |
| English Learners | 92.0% | 13.7 | 25.4% | 7.9% |
| Low Income | 91.6% | 14.7 | 27.3% | 8.6% |
| Students with Disabilities | 91.9% | 14.3 | 24.8% | 8.3% |
| Female | 93.5% | 11.4 | 17.4% | 4.8% |
| Male | 93.6% | 11.2 | 16.8% | 4.8% |
The largest gaps are connected more strongly with student-group characteristics than with gender in the statewide data. Female students had a chronic absenteeism rate of 17.4% and male students 16.8%, while several high-needs and income-related groups were above 24%.
How Massachusetts Measures Chronic Absenteeism
The current Massachusetts Education-to-Career Research and Data Hub attendance documentation describes chronic absenteeism as missing at least 10% of days enrolled. Attendance indicators are calculated for students in grades PK–12 with at least 20 days in membership.
The percentage is tied to each student’s enrollment period rather than a fixed statewide number of absences. A student enrolled for a typical 180-day year reaches the 10% level at about 18 missed days. A student enrolled for 90 days reaches the same percentage after about nine missed days.
Chronic absenteeism also does not depend on whether an absence is excused or unexcused. The attendance report separately publishes an Unexcused > 9 days measure, so that indicator should not be treated as another name for chronic absenteeism.
Ten Days Absent Is a Different Measure
Massachusetts also reports the share of students who were absent for 10 or more days. In 2025–26, 41.0% of students were absent at least 10 days, while 17.1% were chronically absent under the 10%-of-days-enrolled measure. The two percentages answer different questions and should not be substituted for one another.
The same report shows that 4.8% of Massachusetts students missed at least 20% of their enrolled days in 2025–26. This identifies a smaller group with much more extensive absence than the standard 10% chronic absenteeism threshold.
March and End-of-Year Rates
DESE publishes both March and end-of-year attendance data. For 2025–26, the statewide chronic absenteeism rate was 16.8% in the March reporting period and 17.1% at the end of the school year. The March figure reflects attendance only through March 1, while the end-of-year figure covers attendance through the last day of school.
For trend analysis, March values should be compared with other March values and end-of-year values with other end-of-year values. Mixing the two reporting periods can create a misleading change even when the underlying attendance pattern has not shifted by the same amount.