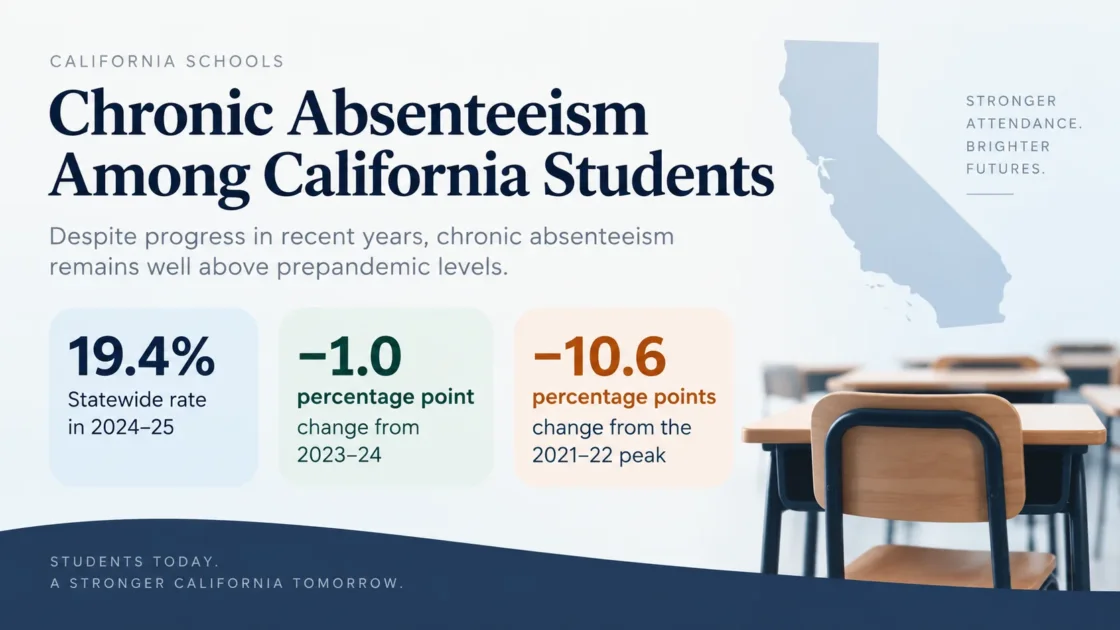
2024–25Latest available school year
−1.0 ppChange from 2023–24
TK–12DataQuest reporting scope
California’s statewide chronic absenteeism rate fell to 19.4% in 2024–25, down from 20.4% a year earlier and well below the 30.0% recorded in 2021–22. The latest figure covers public school students from transitional kindergarten through grade 12 in the California Department of Education’s DataQuest reporting. The rate has now declined for three consecutive school years after the 2021–22 peak. California Department of Education 2024–25 End-of-Year Reports.
The improvement is broad, but chronic absence remains above the 12.1% statewide rate reported for 2018–19. Rates also vary widely among student groups, with foster youth, homeless youth, several racial and ethnic groups, and students with disabilities recording rates well above the statewide level.
As of September 2026, 2024–25 remains the latest school year with a released statewide chronic absenteeism rate. The CDE lists the 2025–26 Chronic Absenteeism Reports among its planned Fall 2026 DataQuest releases. CDE DataQuest Schedule.
California’s Chronic Absenteeism Rate in 2024–25
California considers a student chronically absent when the student misses 10% or more of the instructional days they were enrolled to attend. The statewide DataQuest rate is calculated by dividing the number of eligible students identified as chronically absent by the chronic absenteeism eligible enrollment.
20.4%
Statewide TK–12 rate
19.4%
Down 1.0 percentage point
The latest decline continues the recovery from the unusually high absenteeism levels recorded after the pandemic-era disruption. From 2021–22 to 2024–25, the statewide rate dropped by 10.6 percentage points. It is still 7.3 percentage points above the 2018–19 rate.
Statewide Trend Since the Pre-Pandemic School Year
Statewide DataQuest rates for eligible students in TK–12.
California did not publish 2019–20 chronic absenteeism data because the CDE determined that absenteeism data for that school year were not valid and reliable. Source: California Department of Education Chronic Absenteeism Data.
| Academic Year | Chronic Absenteeism Rate | Context |
|---|---|---|
| 2018–19 | 12.1% | Pre-pandemic reference year |
| 2019–20 | Not available | CDE did not process the data for public release |
| 2020–21 | 14.3% | Distance-learning period affected year-to-year comparison |
| 2021–22 | 30.0% | Highest rate in the series |
| 2022–23 | 24.9% | Down 5.1 percentage points |
| 2023–24 | 20.4% | Down 4.5 percentage points |
| 2024–25 | 19.4% | Down 1.0 percentage point |
The direction since 2021–22 is clear: statewide chronic absenteeism has fallen each year. The pace of improvement has slowed, however. The decrease was 5.1 percentage points in 2022–23, 4.5 points in 2023–24, and 1.0 point in 2024–25.
The CDE advises caution when comparing absenteeism across academic years because the pandemic changed school operations and attendance reporting. No statewide 2019–20 chronic absenteeism file is available for public release.
Chronic Absenteeism Varies Widely Across Student Groups
The statewide average does not describe every student population equally. CDE’s 2024–25 end-of-year results show rates ranging from 8.1% for Asian students to 37.3% for foster youth among the groups highlighted in the state release.
| Student Group | 2024–25 Rate | Change From 2023–24 |
|---|---|---|
| Foster Youth | 37.3% | +0.3 pp |
| Homeless Youth | 34.9% | −1.4 pp |
| American Indian or Alaska Native | 31.6% | −1.4 pp |
| African American | 31.3% | −1.0 pp |
| Pacific Islander | 31.3% | −1.0 pp |
| Students with Disabilities | 27.7% | −1.3 pp |
| Socioeconomically Disadvantaged | 24.1% | −1.2 pp |
| Hispanic or Latino | 22.3% | −1.3 pp |
| English Learner | 21.3% | −1.5 pp |
| Statewide | 19.4% | −1.0 pp |
| Migrant | 17.3% | −0.6 pp |
| Two or More Races | 16.5% | −0.8 pp |
| White | 15.1% | −0.8 pp |
| Filipino | 9.1% | −0.9 pp |
| Asian | 8.1% | −0.5 pp |
Every race and ethnicity group listed by CDE had a lower chronic absenteeism rate than in 2023–24. Most program participation groups also improved. Foster youth were the exception among the highlighted program groups, rising from 37.0% to 37.3%. The underlying figures are published in the CDE’s 2024–25 End-of-Year Results fact sheet.
Some student groups overlap. A student can, for example, be both socioeconomically disadvantaged and an English learner. Because of that overlap, the statewide rate cannot be calculated by averaging the subgroup rates.
Why California Shows Both 19.4% and 17.1%
Two different statewide chronic absenteeism figures can appear in California education data for 2024–25. DataQuest reports a 19.4% statewide TK–12 rate, while the 2025 California School Dashboard reports 17.1% for TK–8.
19.4%
2024–25 statewide data covering TK–12
17.1%
2025 Dashboard indicator covering TK–8
The figures are not interchangeable because the reporting scope differs. California’s Chronic Absenteeism Indicator on the School Dashboard applies to schools and districts serving students from transitional kindergarten through grade eight. High school chronic absenteeism is still collected and reported through DataQuest. The CDE also notes that Dashboard downloadable data can differ from DataQuest results because the two reporting systems apply their own reporting rules. CDE Chronic Absenteeism Indicator.
How California Determines Whether a Student Is Chronically Absent
The 10% threshold is based on the instructional days a student was expected to attend, rather than a fixed statewide number of missed days. A student expected to attend 180 instructional days, for example, reaches the 10% level after 18 missed days. A student enrolled for a shorter period has a different numeric threshold.
For DataQuest chronic absenteeism reporting, students generally must be expected to attend for at least 31 instructional days at the selected reporting entity to enter the eligible enrollment denominator. Students who were enrolled but did not attend the selected entity are not eligible there. CDE also removes certain exempt students, including students enrolled in non-public schools, students receiving home or hospital instruction, and students attending community college full time. CDE Chronic Absenteeism Data File Structure.
California’s chronic absenteeism measure is based on the share of instructional days missed. It is not limited to unexcused absences. Truancy is a separate attendance concept tied to unexcused absences and state attendance requirements.
At the state, county, district, and school levels, the chronic absenteeism rate is the unduplicated number of eligible students determined to be chronically absent divided by eligible chronic absenteeism enrollment. Because eligibility and enrollment can change by reporting level, a student’s status is calculated using attendance information applicable to that level.
Does Attendance Recovery Remove Absences From California Chronic Absenteeism?
No, not from the regular California School Dashboard or DataQuest chronic absenteeism calculation. Beginning with the 2025–26 school year, California collects data for the Attendance Recovery program, but the CDE states that use of Attendance Recovery will not change chronic absenteeism data reported on the 2026 Dashboard or through DataQuest.
Attendance Recovery is an optional TK–12 program established by Senate Bill 153 and amended by Senate Bill 176. Participating local educational agencies can offer qualifying sessions outside the regularly scheduled school day. Students can earn attendance recovery time that allows an LEA to claim average daily attendance, or ADA, for qualifying absences. The amount is limited to 10 days per student or the student’s qualifying absences at the LEA, whichever is less. CDE Attendance Recovery.
Absences Remain
Attendance Recovery does not alter the standard chronic absenteeism measure
Up to 10 Days
May be used for ADA purposes when program requirements are met
CALPADS now includes a separate Attendance Recovery Days field on the Student Absence Summary file. LEAs began reporting these days with the 2025–26 End-of-Year 1 collection. The existing absence fields are not reduced or rewritten because a student earned Attendance Recovery days.
California collects Attendance Recovery Days so the CDE can calculate and publish an alternative chronic absenteeism rate. That alternative calculation is separate from the chronic absenteeism measure used in DataQuest and the California School Dashboard. CALPADS Update Flash #305.
Attendance Recovery can generate ADA for qualifying recovered time, but it does not remove the original absences from the standard Dashboard or DataQuest chronic absenteeism calculation.
What the 2024–25 Absence Data Show Beyond the Chronic Rate
California also publishes an Absenteeism by Reason report. It separates reported absences into excused absences, unexcused absences, out-of-school suspensions, and incomplete independent study. In 2024–25, 51.8% of reported absences by reason were excused. The statewide average was 12.8 days absent, down from 16.7 days in 2021–22. CDE 2024–25 End-of-Year Reports.
The Absenteeism by Reason report includes students who were absent at least once during the academic year. Its percentages and average days absent are separate from the 19.4% statewide chronic absenteeism rate, which uses chronic absenteeism eligible enrollment as its denominator.
California’s latest data show two patterns at the same time: statewide chronic absenteeism continues to move down from the 2021–22 peak, while nearly one in five eligible TK–12 students still met the chronic absence threshold in 2024–25. The remaining gap is much larger for several student populations, particularly foster youth, homeless youth, American Indian or Alaska Native students, African American students, Pacific Islander students, and students with disabilities.