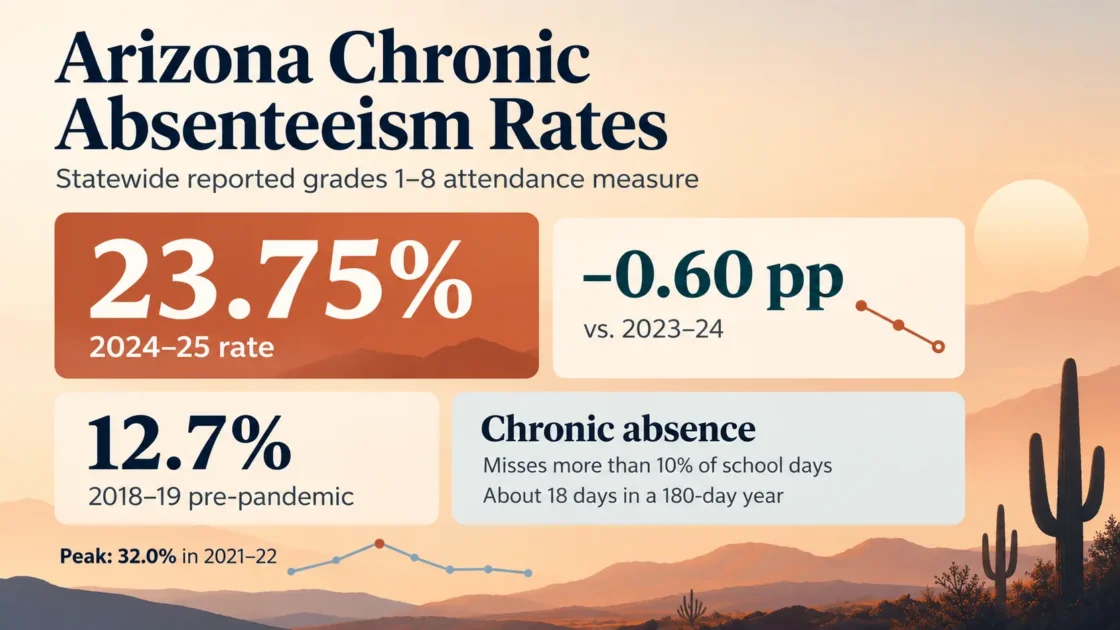
Arizona’s latest verified statewide chronic absenteeism rate for the state’s reported grades 1–8 measure is 23.75% for the 2024–25 school year. That is down from 24.35% in 2023–24, a decline of 0.60 percentage points. The latest rate remains well above the 12.7% reported for 2018–19. Read On Arizona reports the 2024–25 figure from new Arizona Department of Education data released in December 2025, while the Arizona Department of Education School Report Cards provide the state reporting definition and chronic absenteeism data.
−0.60 ppChange from 2023–24
32.0%2021–22 state-reported peak
12.7%2018–19 pre-pandemic rate
Arizona School Report Cards describe a student in grades 1–8 as chronically absent when the student misses more than 10% of the school’s calendar days. Arizona research using ADE data commonly describes the threshold as 10% or more for any reason, including excused and unexcused absences. In a typical 180-day year, the threshold is around 18 missed days. Chronic absenteeism is an attendance measure and should not be treated as the same thing as truancy, which concerns unexcused absence under attendance rules.
Arizona Chronic Absenteeism Rates by School Year
The state-reported series shows a sharp rise from the pre-pandemic level, followed by three consecutive declines after 2021–22. The latest change was much smaller than the drops recorded in the preceding two years.
State-reported chronic absenteeism percentages. The disrupted 2019–20 year is excluded from this trend comparison.
Rates follow Arizona’s state-reported series. The latest two exact values are 24.35% and 23.75%; earlier values are displayed at the precision available in the historical series.
| School Year | Chronic Absenteeism Rate | Change From Prior Displayed Year |
|---|---|---|
| 2017–18 | 12.0% | — |
| 2018–19 | 12.7% | +0.7 pp |
| 2020–21 | 22.3% | +9.6 pp |
| 2021–22 | 32.0% | +9.7 pp |
| 2022–23 | 28.1% | −3.9 pp |
| 2023–24 | 24.35% | −3.75 pp |
| 2024–25 | 23.75% | −0.60 pp |
From the 32.0% rate in 2021–22 to 23.75% in 2024–25, Arizona’s reported rate fell 8.25 percentage points, a relative decline of about 25.8%. The latest rate is still 11.05 percentage points above 2018–19. Put another way, the 2024–25 rate is about 1.87 times the pre-pandemic 2018–19 rate.
The year-over-year improvement also slowed. The rate fell 3.9 points from 2021–22 to 2022–23 and another 3.75 points in 2023–24, but only 0.60 points in 2024–25.
Helios Education Foundation and WestEd, using student-level data supplied by ADE, found an 8% within-school chronic absence rate in 2019–20. Their report cautions that school-building closures disrupted attendance reporting, so the unusually low value should not be read as evidence of improved attendance. Keeping that year out of the main comparison avoids treating a reporting-disrupted period as an ordinary school year.
Chronic Absenteeism Rates Across Arizona Student Groups
The statewide average masks wide differences among student groups. Arizona’s 2024–25 reporting shows rates below the state average for Asian, white and multiracial students, while several other reported groups were above it.
| Student Group | Rate | Difference From 23.75% State Rate |
|---|---|---|
| Asian | 9.0% | −14.75 pp |
| White | 17.8% | −5.95 pp |
| Two or More Races | 20.5% | −3.25 pp |
| Black or African American | 23.4% | −0.35 pp |
| Hispanic or Latino | 27.9% | +4.15 pp |
| Native Hawaiian or Pacific Islander | 29.3% | +5.55 pp |
| American Indian or Alaska Native | 37.3% | +13.55 pp |
| Limited English Proficiency | 27.6% | +3.85 pp |
| Economically Disadvantaged | 29.8% | +6.05 pp |
| Students Experiencing Homelessness | 39.7% | +15.95 pp |
The largest gap in this selected 2024–25 group table is for students experiencing homelessness, whose 39.7% rate was 15.95 percentage points above the overall rate. American Indian or Alaska Native students were also well above the statewide average at 37.3%. These are descriptive differences in the attendance data; the rates alone do not establish why a particular group has a higher or lower value.
The underlying subgroup reporting comes from Arizona’s School Report Cards data. ADE applies privacy protections to small groups in its public reporting, so suppressed values should not be reconstructed or estimated from other cells.
What the Arizona State Rate Measures
The 23.75% figure is not an all-grade K–12 rate. Arizona’s public chronic absenteeism measure used in the School Report Cards applies to grades 1–8. That scope matters when comparing Arizona with states that publish one all-grade K–12 percentage.
- The measure counts absences regardless of whether they are excused or unexcused.
- The state reporting measure is tied to attendance at a given school rather than simply adding every absence across every Arizona school a student attended during the year.
- Student mobility can therefore affect whether a student crosses the chronic absence threshold in the state measure.
- The statewide percentage should not be converted into a student count unless a matching reporting denominator is available for the same measure and school year.
The last point is especially relevant for Arizona. The public percentage series used here does not provide a matching statewide chronic-absence count alongside the latest rate in the same reporting view, so no student count is estimated from statewide enrollment.
A separate Helios and WestEd analysis of ADE-provided student-level grades 1–8 data reported 34% for 2021–22 and 29% for 2022–23 under its within-school calculation. The state-reported comparison series gives 32.0% and 28.1% for those years. The studies use related concepts but different analytical construction and reporting populations, so their values should remain separate rather than being stitched into one trend line.
The Helios and WestEd student-level study also tested an alternative method that accumulated absences across all schools a student attended during the year. Under that method, Arizona’s statewide rate was generally about one percentage point higher than the within-school calculation, with larger differences for students who changed schools. This illustrates why an apparently small change in denominator or enrollment treatment can alter a chronic absenteeism rate.
Arizona High School Chronic Absence Uses a Separate Research Measure
Arizona Department of Education’s standard chronic absenteeism calculation does not extend the School Report Cards grades 1–8 measure to grades 9–12. To examine high school attendance, Helios Education Foundation and WestEd applied the Arizona chronic-absence concept to high school students using ADE data.
23.75%
Latest state-reported rate, 2024–25
34%
Helios/WestEd research rate, 2023–24
The high school study found that chronic absence peaked at 42% in 2021–22 and declined to 34% in 2023–24. Before the pandemic, annual high school rates were generally between 21% and 24%. Because the high school value comes from a separate research analysis and covers a different school year, 34% should not be presented as Arizona’s 2024–25 statewide K–12 rate.
| Student Group | Rate |
|---|---|
| All High School Students | 34% |
| Asian | 15% |
| White | 27% |
| Other Race/Ethnicity | 30% |
| Black or African American | 35% |
| Hispanic or Latino | 39% |
| American Indian or Alaska Native | 53% |
| Students with Disabilities | 40% |
| Economically Disadvantaged | 43% |
| English Language Learners | 47% |
As of October 29, 2026, the latest statewide Arizona grades 1–8 chronic absenteeism rate located in the state reporting cycle remains the 2024–25 rate of 23.75%. Individual Arizona schools may already report 2025–26 attendance results, but a school-level value should not be substituted for a statewide rate.