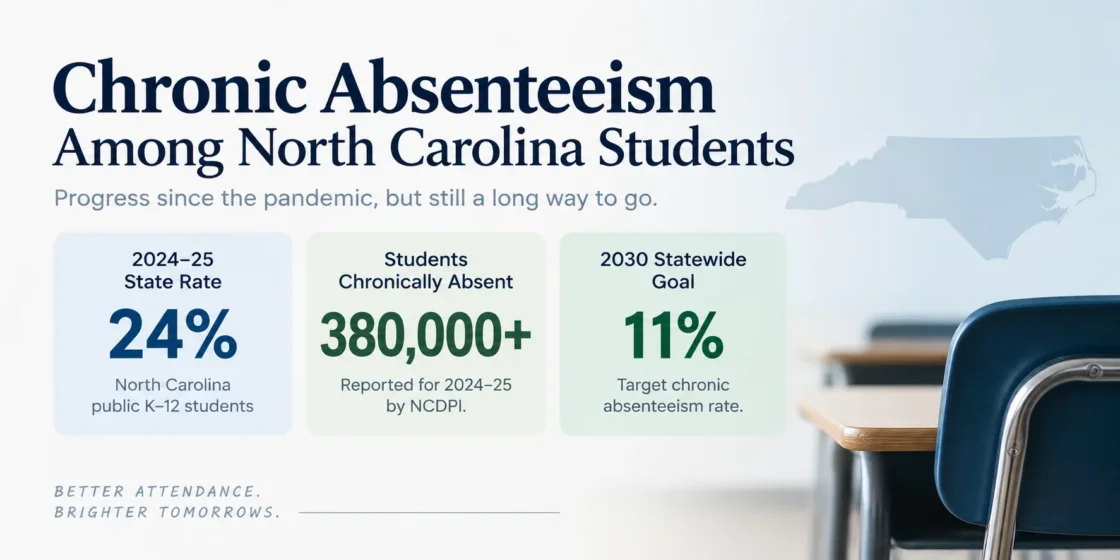
North Carolina’s chronic absenteeism rate fell again in 2024–25, but the state remains far above its pre-pandemic level. A student is counted as chronically absent when the student has been enrolled in a North Carolina public school for at least 10 school days and has been absent for at least 10% of the days enrolled. Excused, unexcused, and disciplinary absences can all contribute to that measure.3
North Carolina Remains Above Its Pre-Pandemic Attendance Level
The statewide rate reached about 31% in 2021–22 and then moved down to 27% in 2022–23, 25% in 2023–24, and 24% in 2024–25. The latest one-year change was therefore only 1 percentage point, smaller than the declines immediately after the 2021–22 peak.1
Published statewide benchmark rates. The school-year labels use the year in which each school year ended.
The benchmark values come from North Carolina School Report Card data reported through myFutureNC. The 2018–19, 2021–22, and 2022–23 figures are also reported in the 2025 Educational Attainment Report.14
| School Year | Chronic Absenteeism Rate | Change From Prior Shown Year |
|---|---|---|
| 2017–18 | 15% | — |
| 2018–19 | 16% | +1 pp |
| 2021–22 | 31% | Not treated as a continuous comparison |
| 2022–23 | 27% | −4 pp |
| 2023–24 | 25% | −2 pp |
| 2024–25 | 24% | −1 pp |
The 2019–20 year is not used as a normal trend point because attendance reporting was disrupted. A North Carolina research series also omits 2019–20 and 2020–21 because remote schooling could change how absences were recorded.15
From the 2021–22 peak to 2024–25, the statewide rate fell by 7 percentage points, a relative decline of about 22.6%. It is still 8 percentage points above the 16% reported for 2018–19, which is 50% higher on a relative basis. Published student counts show the scale behind those rates: about 241,000 students were chronically absent in 2018–19, about 483,000 in 2021–22, and 417,152 in 2022–23.4
The 24% rate is also 13 percentage points above North Carolina’s 2030 goal of 11%. Reaching that target would require a relative reduction of about 54% from the 2024–25 rate. myFutureNC estimates that 207,536 more students would need to attend school more regularly for the state to meet the goal.1
Average Days Absent Are Still Above the Pre-Pandemic Level
EPIC’s research sample shows the same incomplete recovery in a different metric. The average student missed 9.8 days in 2018–19, 15.0 days in 2021–22, and 13.1 days in 2024–25. The change from 2023–24 to 2024–25 was only 0.2 day.5
| School Year | Average Days Absent |
|---|---|
| 2017–18 | 9.5 |
| 2018–19 | 9.8 |
| 2021–22 | 15.0 |
| 2022–23 | 13.9 |
| 2023–24 | 13.3 |
| 2024–25 | 13.1 |
The Official 24% Rate and the 22.2% Research Rate Use Different Student Populations
Two current North Carolina sources can appear to give different answers for 2024–25. The statewide School Report Card measure is 24%, while the Education Policy Initiative at Carolina, or EPIC, reports 22.2% in its research sample. The difference comes from eligibility rules rather than from two competing definitions of the 10% absence threshold.
24%
Public K–12 students enrolled at least 10 school days; rate reported through North Carolina School Report Card data.1
22.2%
Excludes students enrolled fewer than 90 days and students absent for more than half of enrolled days.5
EPIC’s analytical files contain roughly 1.5 million students per year and about 2,600 to 2,700 schools. The researchers state that their chronic absenteeism estimates run about 1 to 2 percentage points below official state metrics because of the sample restrictions.5
A percentage should be compared only after checking who was eligible for the calculation. The 24% statewide figure is the appropriate headline rate for North Carolina; the 22.2% EPIC figure is useful for analyses that rely on EPIC’s more restricted longitudinal sample.
The 10% Threshold Is Based on Days Enrolled
North Carolina does not define chronic absenteeism as a fixed 18-day rule for every student. The threshold is 10% of the days the individual student was enrolled. Eighteen days is the 10% threshold only for a student enrolled for 180 days.3
| Days Enrolled | 10% of Enrolled Days |
|---|---|
| 180 | 18 days |
| 120 | 12 days |
| 100 | 10 days |
| 50 | 5 days |
North Carolina’s chronic-absence measure can include excused, unexcused, and disciplinary absences. The state’s attendance manual distinguishes it from truancy measures that focus on unexcused absences.3
Race and Community Type Show Uneven Statewide Rates
Chronic Absenteeism by Race and Ethnicity in 2024–25
Statewide School Report Card data show a 29-percentage-point span across the published racial and ethnic groups. American Indian students had the highest reported rate at 40%, while Asian students had the lowest at 11%. The statewide benchmark was 24%.1
North Carolina public K–12 students, using the published statewide categories.
Rates are from the 2024–25 North Carolina chronic absenteeism dashboard based on NCDPI School Report Card data.1
| Student Group | Rate | Difference From Statewide 24% |
|---|---|---|
| American Indian | 40% | +16 pp |
| Black | 31% | +7 pp |
| Hispanic | 28% | +4 pp |
| Multiracial | 28% | +4 pp |
| White | 19% | −5 pp |
| Asian | 11% | −13 pp |
The group rates describe where absenteeism was more or less common; they do not identify a cause for the gaps. The American Indian rate was 16 percentage points above the statewide rate, while the Asian rate was 13 points below it.
Urban and Rural Non-Metro Students Shared the Highest Community-Type Rate
| Community Type | Rate | Difference From Statewide 24% |
|---|---|---|
| Urban | 27% | +3 pp |
| Rural, non-metro | 27% | +3 pp |
| Rural, metro | 26% | +2 pp |
| Suburban | 23% | −1 pp |
The four community categories were separated by only 4 percentage points. The highest published rate was not confined to one side of an urban-rural divide: urban students and rural non-metro students both registered 27%.
EPIC Data Show Different Patterns by Grade and Student Need
The next breakdowns use EPIC’s research sample rather than the statewide reporting denominator. They should therefore be read within the 22.2% research-sample rate, not mixed directly with the 24% official statewide rate.5
Rates Fell Through Elementary Grades, Then Rose
Research-sample rates; these are not the official statewide reporting denominator.
EPIC administrative-data analysis for the 2024–25 school year.5
| Grade Band | Average Days Absent | Chronic Absence Rate | Students in Sample |
|---|---|---|---|
| Kindergarten | 13.8 | 24.4% | 110,173 |
| Grades 1–2 | 12.2 | 19.3% | 227,920 |
| Grades 3–5 | 11.4 | 17.4% | 346,979 |
| Grades 6–8 | 13.6 | 23.9% | 348,061 |
| Grade 9+ | 14.3 | 25.4% | 464,135 |
The pattern is U-shaped rather than a steady increase with age. Kindergarten was high at 24.4%, the rate reached its low point of 17.4% in grades 3–5, and then rose to 23.9% in grades 6–8 and 25.4% in grade 9 and above. Grade 9+ students also had the highest average days absent among the grade bands, at 14.3 days.
Economic Disadvantage Produced the Largest Gap in the EPIC Sample
| Student Group | Average Days Absent | Chronic Absence Rate | Students in Sample |
|---|---|---|---|
| Economically disadvantaged | 16.0 | 30.9% | 740,649 |
| Not economically disadvantaged | 10.3 | 13.7% | 756,619 |
| Students with disabilities | 15.7 | 29.8% | 200,241 |
| Students without disabilities | 12.7 | 21.0% | 1,297,027 |
| Multilingual learners | 14.6 | 26.5% | 172,751 |
| Students not identified as multilingual learners | 12.9 | 21.7% | 1,324,517 |
Within this sample, economically disadvantaged students had a chronic absence rate 17.2 percentage points above students who were not economically disadvantaged. The gap was 8.8 points for students with disabilities compared with students without disabilities, and 4.8 points for multilingual learners compared with students not identified as multilingual learners. The same ordering appears in average days absent.
Recovery Is Slowest at the High-Absence End
The statewide decline does not mean every part of the attendance distribution is improving at the same pace. EPIC’s percentile analysis shows larger movement near the middle than among students and schools with the highest absence levels.5
Student Absence Days Improved More at the Median
| Student Percentile | 2023–24 Days Absent | 2024–25 Days Absent | Change |
|---|---|---|---|
| 10th percentile | 2.1 | 2.1 | 0.0 |
| Median | 10.1 | 9.6 | −0.5 |
| 90th percentile | 27.9 | 27.6 | −0.3 |
The median student missed half a day less in 2024–25 than in 2023–24, a decline of about 5%. At the 90th percentile, the reduction was only 0.3 day, or about 1%. Students near the high-absence end were therefore improving more slowly than the middle of the distribution.
The Highest-Absence Schools Moved in the Opposite Direction
| School Percentile | 2023–24 Rate | 2024–25 Rate | Change |
|---|---|---|---|
| 10th percentile | 9.5% | 8.7% | −0.8 pp |
| Median | 22.2% | 20.6% | −1.6 pp |
| 90th percentile | 39.3% | 39.8% | +0.5 pp |
The median school improved by 1.6 percentage points, and a school at the 10th percentile improved by 0.8 points. At the 90th percentile, however, the chronic absence rate rose from 39.3% to 39.8%. Statewide improvement can therefore occur while the highest-absence schools remain near 40%.
NCDPI Identified 310 Attendance Bright-Spot Schools
NCDPI does not define a bright spot simply as a school with a low absenteeism rate. Its model accounts for the share of economically disadvantaged students, enrollment, grade configuration, beginning-teacher share, the school’s 2021–22 chronic absenteeism rate, and district context. A school must have a 2024–25 rate that performs better than the model would expect for schools with similar characteristics and must also have reduced chronic absenteeism by at least 5 percentage points from 2021–22.2
Among traditional public schools, bright spots appeared in 66 of North Carolina’s 115 districts. The median bright-spot school served a student population in which 59% were economically disadvantaged. Those results show that the statewide slowdown and the difficult high-absence tail coexist with large attendance gains in schools serving varied communities.2