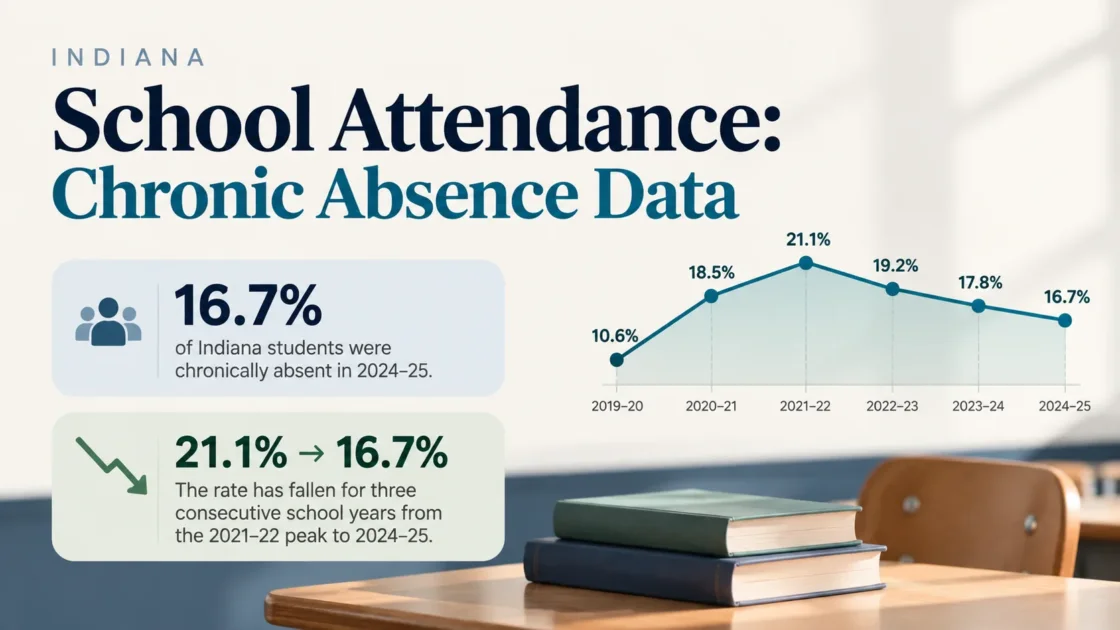
Indiana’s latest statewide chronic absenteeism rate is 14.9% for 2025–26. The rate fell 1.8 percentage points from 16.7% in 2024–25, marking a fourth consecutive annual decline after the 21.2% peak in 2021–22. The 2025–26 rate remains 4.3 percentage points above the 10.6% level reported for 2019–20.1
Indiana Chronic Absenteeism Trend
Indiana’s statewide rate rose sharply during the pandemic period and reached 21.2% in 2021–22. It then declined to 19.2% in 2022–23, 17.8% in 2023–24, 16.7% in 2024–25, and 14.9% in 2025–26. The change from the 2021–22 peak to 2025–26 is 6.3 percentage points, or about a 29.7% relative decline.1
Percentage of Indiana students classified as chronically absent.
State data show four consecutive annual declines after the 2021–22 peak.1
| School Year | Chronic Absenteeism Rate | Change From Prior Year |
|---|---|---|
| 2019–20 | 10.6% | — |
| 2020–21 | 18.5% | +7.9 pp |
| 2021–22 | 21.2% | +2.7 pp |
| 2022–23 | 19.2% | −2.0 pp |
| 2023–24 | 17.8% | −1.4 pp |
| 2024–25 | 16.7% | −1.1 pp |
| 2025–26 | 14.9% | −1.8 pp |
Grade-Level Patterns
Every grade level had a lower chronic absenteeism rate in 2025–26 than in 2024–25. Rates were lowest in grade 4 at 8.9% and remained highest in high school, reaching 30.0% in grade 12.1
The grade pattern remains lowest in the elementary grades and rises through middle and high school, with grades 9–12 recording the highest rates.1
| Grade | Rate |
|---|---|
| Kindergarten | 14.1% |
| Grade 1 | 11.2% |
| Grade 2 | 9.7% |
| Grade 3 | 9.7% |
| Grade 4 | 8.9% |
| Grade 5 | 9.8% |
| Grade 6 | 11.0% |
| Grade 7 | 12.7% |
| Grade 8 | 14.3% |
| Grade 9 | 16.1% |
| Grade 10 | 18.5% |
| Grade 11 | 21.3% |
| Grade 12 | 30.0% |
The gap between grade 4 and grade 12 was 21.1 percentage points. Grade 12’s rate was more than three times the grade 4 rate.
Chronic Absence Across Student Groups
Indiana’s 2025–26 data show lower chronic absenteeism rates than in 2024–25 for most reported race and ethnicity groups. American Indian and Native Hawaiian or Other Pacific Islander students were the two exceptions, with small year-over-year increases. Every listed group remained below its 2021–22 rate.1
Rates by Race and Ethnicity
| Student Group | 2019–20 | 2020–21 | 2021–22 | 2022–23 | 2023–24 | 2024–25 | 2025–26 |
|---|---|---|---|---|---|---|---|
| American Indian | 13.9% | 21.5% | 25.7% | 26.0% | 23.5% | 21.3% | 21.4% |
| Asian | 5.3% | 9.9% | 12.0% | 12.4% | 11.4% | 11.0% | 10.4% |
| Black | 19.2% | 38.0% | 34.4% | 30.7% | 28.5% | 26.9% | 25.7% |
| Hispanic | 12.9% | 24.7% | 26.7% | 24.4% | 22.2% | 21.0% | 19.0% |
| Multiracial | 13.5% | 24.6% | 26.8% | 24.5% | 22.2% | 21.5% | 19.2% |
| Native Hawaiian or Other Pacific Islander | 9.3% | 27.2% | 26.3% | 24.1% | 23.9% | 22.7% | 23.3% |
| White | 8.5% | 13.4% | 17.2% | 15.7% | 14.4% | 13.3% | 11.3% |
Black students had the highest reported 2025–26 rate among these groups at 25.7%, while Asian students had the lowest at 10.4%. Since 2021–22, the Black student rate has fallen 8.7 percentage points and the Hispanic student rate has fallen 7.7 points.1
Rates by School Meal Status
| Student Group | 2019–20 | 2020–21 | 2021–22 | 2022–23 | 2023–24 | 2024–25 | 2025–26 |
|---|---|---|---|---|---|---|---|
| Paid Meals | 6.7% | 11.6% | 14.9% | 13.5% | 13.0% | 12.6% | 11.0% |
| Free/Reduced-Price Meals | 15.1% | 27.2% | 29.1% | 25.9% | 23.7% | 22.0% | 20.0% |
The 2025–26 rate for students receiving free or reduced-price meals was 20.0%, compared with 11.0% for students in the paid-meal category, a 9.0-point gap. The free/reduced-price meal rate has fallen for four consecutive years, from 29.1% in 2021–22 to 20.0% in 2025–26.1
Rates by English Learner Status
| Student Group | 2019–20 | 2020–21 | 2021–22 | 2022–23 | 2023–24 | 2024–25 | 2025–26 |
|---|---|---|---|---|---|---|---|
| Non-English Learner | 10.6% | 18.1% | 20.7% | 19.1% | 17.7% | 16.6% | 14.8% |
| English Learner | 10.4% | 23.6% | 22.9% | 20.5% | 18.5% | 17.8% | 16.3% |
English learners had a 16.3% chronic absenteeism rate in 2025–26, compared with 14.8% for non-English learners. The difference was 1.5 percentage points. The English learner rate has declined for five consecutive years, from 23.6% in 2020–21 to 16.3% in 2025–26.1
What Indiana Counts as Chronic Absence
Indiana classifies a student as chronically absent when the student misses at least 10% of school days. Both excused and unexcused absences count toward chronic absenteeism.1
10% of school days
Counts days missed for any reason, including excused and unexcused absences.
10+ unexcused absences
Tracks unexcused absences and is a different measure from chronic absenteeism.
In a 180-day school year, missing 10% of school days corresponds to 18 days. A student can therefore meet the chronic absenteeism threshold even when the missed days are excused.
An attendance rate measures days attended as a share of available school days. Chronic absenteeism classifies individual students according to how much school they miss. A school can have a high overall attendance percentage while still having a group of students who cross the chronic absence threshold.
Latest Published Indiana Data
The Indiana Department of Education’s Data Center now lists a statewide chronic absenteeism file covering 2013 through 2026, along with attendance-rate data covering 2022 through 2026. The 2025–26 school year is therefore included in the state’s current chronic absenteeism release rather than ending with 2024–25.2
Statewide, corporation, school, grade, and student-group rates answer different questions. Comparisons should use the same school year and the same chronic absenteeism definition. A statewide percentage should not be treated as the expected rate for every Indiana district or school.