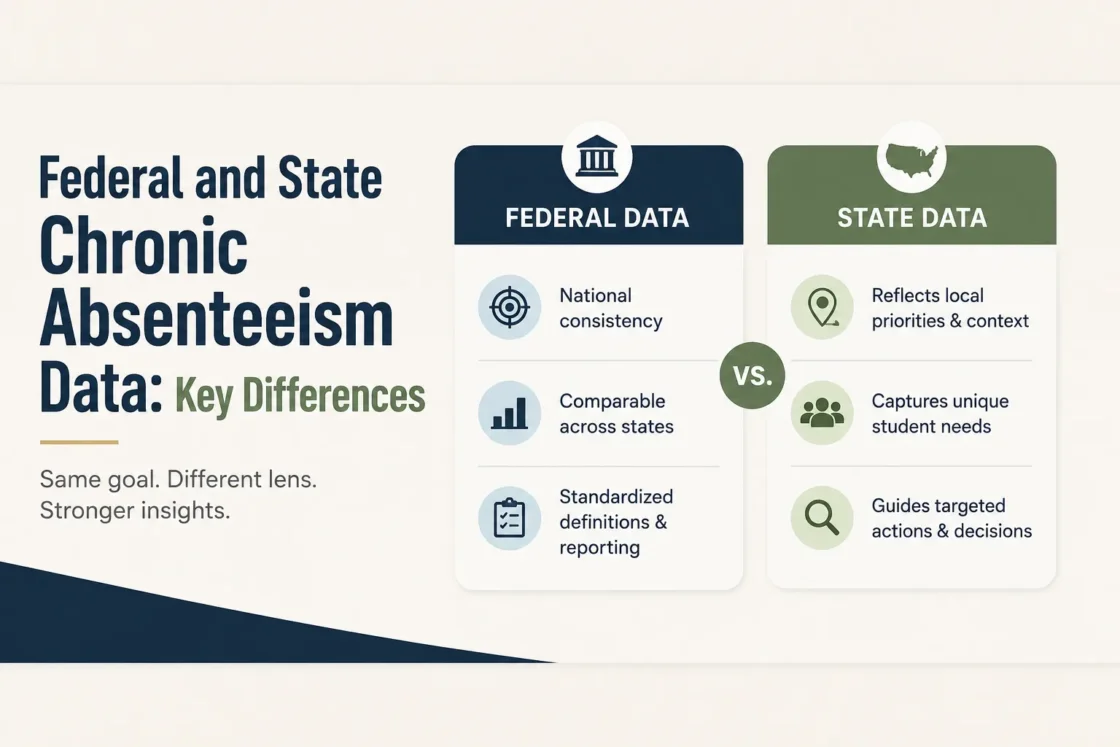
Federal and state chronic absenteeism data measure the same broad problem—students missing a large share of the school year—but the published rates are not automatically interchangeable. The U.S. Department of Education defines chronic absenteeism for its federal reporting data as being absent for 10 percent or more of school days during the school year.1 State systems may use the same 10 percent threshold while applying different eligibility rules, attendance units, denominators, exclusions, aggregation methods, and publication schedules.
| Data Feature | Federal Reporting | State Reporting |
|---|---|---|
| Basic threshold | Generally absent 10% or more of school days | Often 10%, but the attendance unit and eligibility rules can differ |
| Attendance unit | Federal EDFacts instructions use school days | States may calculate from days, instructional days, expected attendance days, or hours |
| Minimum enrollment | Current EDFacts specifications use a minimum of 10 school days for most K–12 students | A state may require a different minimum enrollment period |
| Denominator | Depends on the federal dataset and published calculation method | Usually defined by the state’s eligible attendance population or reporting methodology |
| Transfer students | Federal rules specify how students are counted at school, LEA, and state levels | State systems can recalculate eligibility at different reporting levels |
| Release timing | National files can appear after states have already released newer data | State dashboards and downloadable files may be updated sooner |
| Accountability use | Federal reporting data support national collection and program reporting | A state may use a separate attendance calculation for its report card or ESSA accountability system |
What the Federal Chronic Absenteeism Measure Includes
The federal definition is more specific than simply converting a 180-day school year into an 18-day cutoff. For school year 2023–24, EDFacts File Specification 195 instructs states to report K–12 students and comparable ungraded students who were enrolled in a school for at least 10 school days and were absent for 10 percent or more of the school days in which they were enrolled.2
The same specification distinguishes school-level reporting from LEA- and state-level reporting. A student can be counted at each school where the student meets the chronic-absence definition, but the newer SEA/LEA data group requires the student count to be unduplicated within an LEA and within the state.2
A federal file specification can exist for a newer school year before the corresponding data appear in the main public download product. As of August 2026, the ED Data Express chronic absenteeism files page lists downloadable files for 2020–21, 2021–22, and 2022–23.1
Federal Percentages Can Carry Dataset-Specific Caveats
Federal percentages should be read with the data notes for the school year being analyzed. For the 2020–21 through 2022–23 data shown in ED Data Express, the Department explains that percent chronically absent was calculated by combining chronic absenteeism counts with school membership data. The membership measure is collected at a point in time, while chronic absenteeism covers the school year. The Department therefore warns that differences between the two source datasets can affect interpretation.3
The same federal notes explain that older school-level chronic absenteeism data could produce duplicate students when aggregated upward if a student qualified as chronically absent at more than one school. Privacy protection and data transformations can also affect public values.3 These details are one reason a federal statewide percentage should not be assumed to equal a state’s independently calculated statewide rate for the same school year.
How State Methodology Changes the Published Rate
Many states center their chronic absenteeism measure on the same 10 percent concept, but the calculation around that threshold can be different. California and Ohio show how minimum enrollment, attendance units, and rate weighting can change the reporting population.
| State | Student Threshold | Eligibility or Rate Rule | Reporting Detail |
|---|---|---|---|
| California | Absent 10% or more of expected attendance days | Students generally must be expected to attend at least 31 instructional days at the selected entity | The rate uses chronically absent students divided by Chronic Absenteeism Enrollment4 |
| Ohio | Miss 10% or more of possible attendance hours | At least 100 hours of possible attendance are required for the report-card calculation | District and school rates use enrollment-duration FTE weighting6 |
| New York | Chronic absence remains based on missing 10% or more of school days | Chronic absenteeism continues to be tracked as an attendance measure | A new Attendance indicator replaces the former Chronic Absenteeism indicator in the revised accountability system8 |
California Uses an Eligible Chronic Absenteeism Enrollment
California determines chronic absenteeism separately at the selected reporting level using expected attendance days and actual days attended. Students expected to attend fewer than 31 instructional days at that entity are not eligible for the chronic absenteeism calculation there. The state also removes specified exempt students from eligibility.4
California also illustrates the timeliness difference between state and federal releases. Its public chronic absenteeism file collection includes 2024–25 data, while the dedicated federal ED Data Express download page currently lists chronic absenteeism files only through 2022–23.51
Ohio Calculates Chronic Absence From Attendance Hours
Ohio’s 2025–26 report-card methodology classifies a student as chronically absent when the student misses at least 10 percent of possible attendance hours. A student must have at least 100 possible attendance hours to enter the calculation. For a district or school rate, Ohio converts students to full-time-equivalent values according to enrollment duration and calculates the rate from those weighted FTEs.6
Even two official products within Ohio do not use exactly the same rate calculation. The state’s Attendance Dashboard FAQ says its displayed school or district chronic absence rate is based on the number of students meeting the threshold divided by the total number of students, and specifically notes that the dashboard does not apply FTE weighting in the same way as Ohio School Report Cards.7
A Reported Metric May Differ From the Accountability Indicator
New York provides another type of distinction. NYSED continues to describe chronic absence around the 10 percent threshold, but it has changed the attendance measure used in its accountability system. The newer Attendance indicator replaces the previous Chronic Absenteeism indicator rather than ending the state’s monitoring of chronic absence.8
Why Federal and State Rates for the Same Place May Not Match
- Different school years: a state portal may already show a newer academic year than the available federal public file.
- Different enrollment minimums: federal EDFacts uses a 10-school-day minimum in the current specification, while a state may require another amount of enrollment before a student enters its rate.
- Days versus hours: one system may measure missed days while another uses possible instructional hours.
- Different denominators: the population used to calculate the percentage may exclude students who do not meet state eligibility rules.
- Transfers and multiple enrollments: a student may qualify at more than one school, making deduplication rules relevant to district and statewide totals.
- Different treatment of attendance events: states can have detailed rules for suspensions, partial-day schedules, independent study, virtual instruction, or other attendance situations.
- Weighting: some published rates use student counts, while another official product may weight students according to enrollment duration.
- Privacy and suppression: federal and state public files may alter or suppress small cells under their respective disclosure-protection rules.
- Reporting versus accountability: the chronic absenteeism rate available in a data file may not be the exact attendance measure used to assign an accountability rating.
Before comparing two percentages, verify the school year, student universe, minimum enrollment rule, attendance unit, denominator, reporting level, and calculation method. A methodological difference can create a rate difference even when the underlying attendance records are similar.
Which Data Source Fits the Question
For a national comparison across states, federal EDFacts or ED Data Express provides a common reporting system, but comparisons should stay within the same school year and use the accompanying data notes.3
For the most recent statewide, district, school, or subgroup data, the state education agency is often the better starting point because state releases may precede the national federal publication. The state’s technical documentation should be kept with the rate rather than treating the percentage as a definition-free number.
For an accountability result or state report-card measure, use the methodology for that specific state product. Ohio’s dashboard and report-card calculations demonstrate that two official attendance products can differ even within one state.7
Chronic absenteeism data should also be kept separate from truancy rules. Chronic absenteeism generally measures missed instructional time for reporting or accountability and commonly includes absences regardless of whether they are excused. Truancy is governed by state or local legal and administrative rules and can use different thresholds. A federal 10 percent chronic-absence definition is therefore not a substitute for a state’s truancy law.