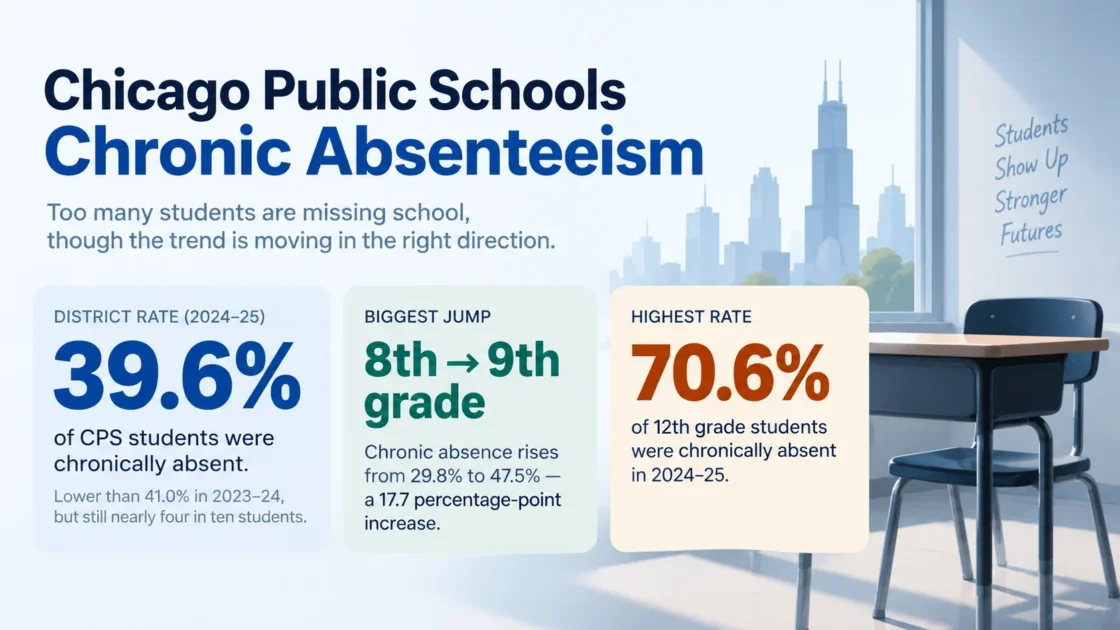
Chicago Public Schools reported a 39.6% district chronic absence rate for 2024–25, with 134,265 students counted as chronically absent in the CPS measure. The rate was lower than the 41.0% recorded in 2023–24, but close to four in ten students still crossed the district’s chronic-absence threshold.
CPS Chronic Absence Fell to 39.6% in 2024–25
The current CPS School Profile display provides a three-year district series. The rate was 40.9% in 2022–23, edged up to 41.0% in 2023–24, then declined to 39.6% in 2024–25. The number of chronic absentees also fell from 141,043 to 134,265 in the latest two displayed years, a decrease of 6,778 students.
School years 2022–23 through 2024–25
The chart uses the district values shown in CPS School Profiles.
| School Year | Chronic Absence Rate | Chronic Absentees |
|---|---|---|
| 2022–23 | 40.9% | 137,822 |
| 2023–24 | 41.0% | 141,043 |
| 2024–25 | 39.6% | 134,265 |
Across the three displayed years, 2023–24 had the highest rate. The 2024–25 rate was 1.4 percentage points below that year and 1.3 points below 2022–23. The direction improved, but the change was modest relative to the size of the districtwide rate.
The Largest Grade-Level Break Appears Between Grades 8 and 9
The 2024–25 grade pattern is not a steady climb from kindergarten onward. Chronic absence falls through much of the elementary sequence, reaches its lowest K–12 rate in grade 5, then begins to rise. The sharp break comes at the transition into high school.
K–12 district rates; PE/PK is listed separately in the exact-data table
Grade 8 to grade 9 is the largest adjacent-grade increase in the K–12 series.
| Grade | Rate | Chronic Absentees |
|---|---|---|
| PE/PK | 53.2% | 10,854 |
| Kindergarten | 36.5% | 8,129 |
| Grade 1 | 32.2% | 7,622 |
| Grade 2 | 29.8% | 7,064 |
| Grade 3 | 28.6% | 6,918 |
| Grade 4 | 27.4% | 6,650 |
| Grade 5 | 26.6% | 6,375 |
| Grade 6 | 26.9% | 6,289 |
| Grade 7 | 27.7% | 6,586 |
| Grade 8 | 29.8% | 7,365 |
| Grade 9 | 47.5% | 12,074 |
| Grade 10 | 55.6% | 15,628 |
| Grade 11 | 57.5% | 14,771 |
| Grade 12 | 70.6% | 17,940 |
Grade 8 was at 29.8%; grade 9 was at 47.5%. That is a 17.7-percentage-point increase between adjacent grades. The rate then remained above half in grades 10 and 11 before reaching 70.6% in grade 12.
Grade 5 had the lowest K–12 rate at 26.6%. The grade 12 rate was about 2.7 times the grade 5 rate. These data identify where absenteeism is more common; they do not establish why the pattern changes across grades.
Economic Status, Temporary Living Situation and IEP Status Show Wide Gaps
CPS publishes its district measure across several student groups. Among the paired comparisons below, temporary living situation and economic disadvantage show the widest 2024–25 gaps.
| Category | Student Group | Rate | Chronic Absentees |
|---|---|---|---|
| Economic status | Economically disadvantaged | 44.1% | 116,094 |
| Economic status | Non-economically disadvantaged | 24.1% | 18,171 |
| Living situation | Temporary Living Situation | 61.9% | 13,739 |
| Living situation | Non-Temporary Living Situation | 38.1% | 120,526 |
| IEP status | IEP | 47.1% | 28,133 |
| IEP status | Non-IEP | 38.0% | 106,132 |
| English learner status | English Learner | 41.1% | 39,637 |
| English learner status | Non-English Learner | 39.0% | 94,628 |
The Temporary Living Situation rate was 23.8 percentage points above the non-temporary-living rate. The economic-disadvantage gap was 20.0 points, the IEP gap was 9.1 points, and the English-learner gap was 2.1 points. CPS also reported the same 39.6% rate for female and male students in 2024–25.
A subgroup difference shows how often chronic absence was recorded within each group. It does not show that the group characteristic caused the absences. Health, transportation, housing, family needs, school experience and other conditions cannot be separated from the rate alone.
Rates Also Differ Across CPS Race and Ethnicity Categories
| Student Group | Rate | Chronic Absentees |
|---|---|---|
| Native American | 46.0% | 501 |
| Black/African American | 45.6% | 53,288 |
| Latinx | 40.8% | 65,359 |
| Hawaiian/Pacific Islander | 40.0% | 148 |
| Multiracial | 25.7% | 1,517 |
| White | 24.7% | 9,334 |
| Asian | 23.4% | 3,731 |
Among these named categories, the rates ranged from 23.4% for Asian students to 46.0% for Native American students. The Black/African American rate was 45.6%, while the Latinx rate was 40.8%. Group sizes vary widely, so rate comparisons should be read together with the reported counts rather than treated as equal-sized populations.
CPS and the Illinois Report Card Publish Different Official Rates
There are two official 2024–25 figures that can appear in searches for Chicago chronic absenteeism. CPS School Profiles report 39.6% under the district’s chronic-absence dataset. The Illinois Report Card reports 40.1% for Chicago Public Schools District 299 under the state reporting system.
39.6%
Chicago district chronic absence measure, 2024–25
40.1%
State reporting measure for District 299, 2024–25
25.4%
Statewide rate under the same Illinois reporting system, 2024–25
For a district-to-state benchmark, the two Illinois Report Card values are the comparable pair. Chicago’s 40.1% rate was 14.7 percentage points above the statewide 25.4% rate in that reporting system.
CPS and the Illinois Report Card use different reporting scopes and processing rules. CPS documents its local dataset for PreK–12 students with at least 11 membership days. Illinois Report Card rules count K–12 students and apply state rules for included home-school enrollments and excluded attendance-day types. The 39.6% and 40.1% figures should therefore remain attached to their own reporting systems.
What CPS Counts as Chronic Absence
In the CPS chronic-absence dataset, a student is counted as chronically absent after missing at least 10% of enrolled school days for any reason. Excused absences, unexcused absences and suspensions are included. The district dataset covers PreK through grade 12 and uses students with at least 11 membership days in the relevant school or district calculation.
- Threshold: at least 10% of enrolled school days missed.
- Absence types: excused and unexcused absences are included; the CPS dataset also includes suspensions.
- Reporting population: PreK–12 students meeting the dataset’s membership requirement.
- Small groups: CPS does not report a row when the denominator has fewer than 10 students.
Ten percent of a 180-day school year is 18 days, which makes 18 days a useful full-year example. The CPS metric itself is based on 10% of each student’s enrolled days, so the exact day count can differ when enrollment covers less than a full school year.
10% or more
CPS chronic absence counts missed attendance regardless of whether the absence is excused or unexcused.
5% or more
CPS policy defines chronic truancy around absence without valid cause, making it a different attendance measure.
CPS data can show where high absence rates are concentrated by year, grade and student group. It cannot identify the reason a particular student was absent, and it should not be used by itself to determine an individual student’s truancy status.