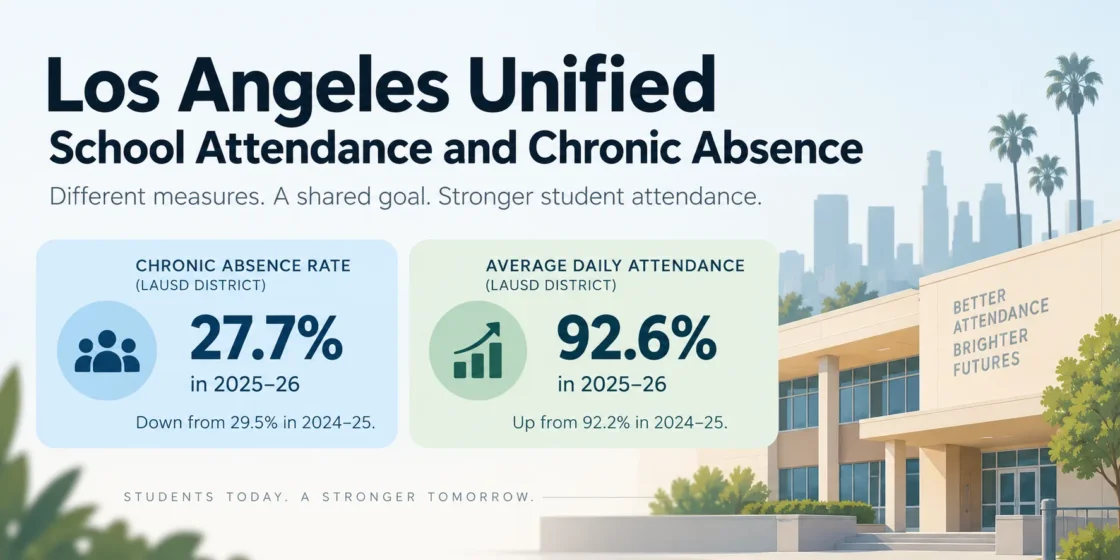
Los Angeles Unified’s September 2026 Board agenda material reports that district chronic absenteeism fell from 29.5% in 2024–25 to 27.7% in 2025–26, while average daily attendance rose from 92.2% to 92.6%. California’s 2025 School Dashboard lists LAUSD at 21.9%, but that is not the same measure: the Dashboard figure uses 2024–25 data and is limited to students in transitional kindergarten through grade 8.
The district chronic-absence rate, California School Dashboard indicator, and LAUSD live Attendance Tracker use different populations and calculation rules. Their percentages should not be combined into one series or treated as conflicting versions of the same statistic.
Why Official LAUSD Chronic Absence Rates Differ
LAUSD uses attendance data for several different purposes. Its district planning materials track chronic absence across grade spans through high school, while the California School Dashboard chronic absenteeism indicator covers only TK–8. The district’s public Attendance Tracker measures something else again: day-to-day attendance rather than the percentage of students who have crossed a chronic-absence threshold.
| Measure | Reporting Period | Published Value | Population and Rule |
|---|---|---|---|
| LAUSD district chronic absenteeism | 2025–26 | 27.7% | Districtwide measure. LAUSD planning materials define its chronic-absence measure as an attendance rate of 91% or lower and report grade-span results through grade 12. |
| California School Dashboard | 2025 Dashboard using 2024–25 attendance data | 21.9% | TK–8 only. Students are considered chronically absent when they miss 10% or more of the instructional days they were enrolled to attend and meet the Dashboard enrollment rules. |
| LAUSD Attendance Tracker | 2026–27 | Preliminary daily rate | Students recorded in attendance for one or more periods divided by enrolled students, subject to stated program exclusions and later adjustments. |
The difference between 27.7% and 21.9% is therefore not a simple data discrepancy. LAUSD’s district measure includes high-school attendance in its internal grade-span reporting, while California explicitly limits its Dashboard chronic absenteeism indicator to TK–8. California Department of Education guidance directs users to DataQuest when chronic absenteeism data for grades 9–12 are needed.
The definitions also are not written identically. LAUSD’s strategic-plan attendance materials identify students with an attendance rate of 91% or lower for its district chronic-absence measure. California law and the Dashboard define a chronic absentee as a student absent for 10% or more of the schooldays used in the calculation. A percentage taken from one system should not be substituted for a value from the other.
LAUSD Chronic Absence Has Fallen From Its Post-Pandemic Peak
LAUSD’s own published benchmark data show a sharp rise from the district’s pre-pandemic reference point, followed by several years of decline. The most recent posted district figure continues that downward direction.
Selected school years reported in district attendance materials
LAUSD’s February 2026 Pupil Services and Attendance presentation reports the values through 2024–25. The 2025–26 endpoint is reported in later LAUSD Board agenda material. The district’s published benchmark series skips intervening school years; no values are estimated for the gaps.
| School Year | Chronic Absence Rate | Reporting Context |
|---|---|---|
| 2017–18 | 15.7% | Pre-pandemic benchmark used by LAUSD |
| 2021–22 | 44.9% | Highest value among the school years shown in LAUSD’s published benchmark series |
| 2022–23 | 36.5% | District cumulative chronic absence |
| 2023–24 | 31.0% | District cumulative chronic absence |
| 2024–25 | 29.5% | District cumulative chronic absence |
| 2025–26 | 27.7% | Later districtwide figure reported in LAUSD Board agenda material |
From 44.9% in 2021–22 to 27.7% in 2025–26, the reported district rate fell by 17.2 percentage points. The latest figure is still 12.0 percentage points above LAUSD’s 15.7% benchmark from 2017–18. From 2024–25 to 2025–26 alone, the district reported a 1.8-point decline.
High School Had the Highest LAUSD Grade-Span Rate in 2024–25
The districtwide rate hides a clear grade pattern. LAUSD’s final 2024–25 grade-span data place grades 9–12 above both elementary and middle grades. The gap was already present in 2023–24 and narrowed only slightly in the following year.
| Grade Span | 2023–24 | 2024–25 | Change |
|---|---|---|---|
| TK–5 | 28.4% | 25.9% | −2.5 pts |
| Grades 6–8 | 28.5% | 27.6% | −0.9 pts |
| Grades 9–12 | 37.2% | 36.9% | −0.3 pts |
| Overall | 31.0% | 29.5% | −1.5 pts |
In 2024–25, the high-school rate was 11.0 percentage points above TK–5 and 9.3 points above grades 6–8. Elementary chronic absence declined by 2.5 points from the prior year, compared with a 0.3-point decline for grades 9–12. The data show a slower improvement at the high-school level without identifying a single cause for that difference.
The 2025 California Dashboard Is a TK–8 Measure
California’s Dashboard provides a second useful view of LAUSD, but its scope must stay attached to the number. The 2025 Chronic Absenteeism Indicator covers students in TK–8 who were enrolled for at least 31 instructional days. A student enters the chronic-absence numerator after being absent for 10% or more of the instructional days the student was enrolled to attend.
| Attendance Year | Rate | Chronically Absent Students | Eligible Students | CDE Published Change |
|---|---|---|---|---|
| 2023–24 | 23.3% | 64,921 | 278,500 | — |
| 2024–25 | 21.9% | 58,700 | 268,519 | −1.5 pts |
The count of chronically absent students in this Dashboard population fell by 6,221, while the eligible population also declined by 9,981. Because both the numerator and denominator changed, the student-count reduction and the rate reduction describe related but different changes.
California’s Dashboard record layout states that the current rate, prior rate, and change field are each rounded to the nearest tenth after their calculations. Subtracting the two displayed rounded rates gives 1.4 points, while CDE’s separately calculated and rounded change field is −1.5 points.
The 2025 Dashboard assigns LAUSD a Very High chronic absenteeism status and an Orange performance level. Under California’s 2025 cut points, a chronic absenteeism rate of 20.1% or higher is classified as Very High. LAUSD’s year-over-year direction is recorded as Declined, which places that combination in Orange.
California states that Dashboard chronic absenteeism data may differ from DataQuest results. The Dashboard measure is limited to TK–8, while DataQuest provides chronic absenteeism reporting through grade 12. Comparisons should stay within the same reporting system and population.
What the 2026–27 LAUSD Attendance Tracker Measures
LAUSD’s public Attendance Tracker is designed for recent attendance monitoring rather than completed-year chronic absenteeism reporting. The district calculates the displayed attendance rate as the number of enrolled students recorded in attendance for one or more periods divided by total enrollment.
The tracker covers TK–12 but excludes students enrolled in virtual academies, City of Angels independent study, home and hospital programs, early education centers, and state preschools. LAUSD states that the data are refreshed after the most recently completed school day and remain preliminary because enrollment and class-assignment changes can alter the figures.
A district can have a high overall attendance rate while a much larger share of individual students accumulate enough missed school to meet a chronic-absence threshold. Subtracting an attendance rate from 100 does not produce the chronic absenteeism rate.
This is why LAUSD could report 92.6% average daily attendance and 27.7% district chronic absenteeism for the same school year. The first describes attendance across the student population over time; the second identifies the share of students meeting the district’s chronic-absence rule.
Attendance Recovery Does Not Remove the Original Absence
California’s Attendance Recovery program became available beginning with the 2025–26 school year. An eligible local educational agency may claim attendance through qualifying recovery instruction, with the annual amount for an individual student capped at the lesser of 10 days or the student’s actual number of absences.
Attendance Recovery changes attendance accounting for allowable ADA purposes, but California Department of Education guidance says it does not remove the original absence from the student information system. Attendance Recovery days are reported separately, and the regular absence fields remain unchanged.
California requires Attendance Recovery data to be reported separately. CDE states that these recovered days do not alter the chronic absenteeism figures reported on the California School Dashboard or DataQuest under the current reporting rules.
LAUSD Attendance Support Uses PSA Counselors and iAttend
Los Angeles Unified’s Pupil Services and Attendance counselors work with schools and families when attendance problems develop. District materials describe their role as identifying barriers to attendance and learning, connecting families with services, and using tiered interventions for absenteeism, truancy, and student engagement.
LAUSD reported more than 26,000 home visits during 2024–25 through Pupil Services and Attendance teams. The district placed the cumulative number at more than 69,000 home visits since the iAttend initiative began. Schools also received monthly attendance strategies tailored to their local attendance patterns.
The district’s attendance data show that these efforts are taking place while chronic absence remains above the 2017–18 benchmark, with the widest final 2024–25 grade-span rate still found in grades 9–12. PSA services therefore operate alongside ongoing district monitoring of daily attendance, cumulative chronic absence, and grade-level attendance patterns.