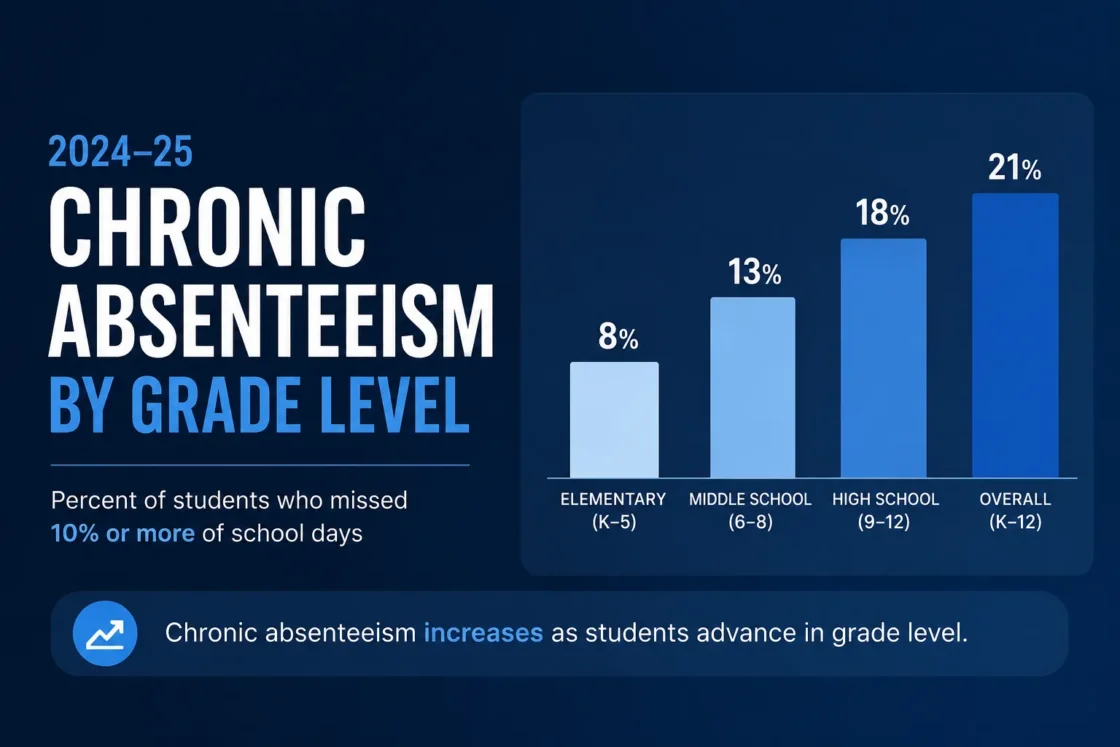
There is not yet one official U.S. 2024–25 chronic absenteeism rate for every grade from kindergarten through 12th grade. Current state and multi-district data point to a clear pattern: rates tend to be higher in kindergarten, fall during the elementary grades, then rise through middle school and reach their highest levels in the later high school grades.
The U.S. Department of Education’s Ed Data Express chronic absenteeism files currently list downloadable federal chronic absenteeism datasets through 2022–23. Several states have already published 2024–25 grade-level results, but differences in eligibility and attendance-reporting methods mean those state rates should not be combined into a single national grade estimate.
Official 2024–25 Chronic Absenteeism Rates by Grade in Indiana
Indiana provides one of the clearest official statewide K–12 breakdowns for 2024–25. The state defines chronic absenteeism as missing at least 10% of school days, including both excused and unexcused absences. Its 2024–25 data show the lowest rate in third grade and a steady rise after elementary school, ending with nearly one-third of 12th graders chronically absent.
Percentage of students classified as chronically absent in each grade.
Data: Indiana State Board of Education, 2024–2025 Chronic Absenteeism Data.
| Grade | Chronic Absenteeism Rate |
|---|---|
| Kindergarten | 16.4% |
| Grade 1 | 13.1% |
| Grade 2 | 11.5% |
| Grade 3 | 10.9% |
| Grade 4 | 11.0% |
| Grade 5 | 11.6% |
| Grade 6 | 13.0% |
| Grade 7 | 14.6% |
| Grade 8 | 16.7% |
| Grade 9 | 17.9% |
| Grade 10 | 20.6% |
| Grade 11 | 23.1% |
| Grade 12 | 31.6% |
Indiana’s rate falls from 16.4% in kindergarten to 10.9% in third grade, a decline of 5.5 percentage points. The direction then reverses. By eighth grade the rate reaches 16.7%, rises to 20.6% in 10th grade, and reaches 31.6% in 12th grade.
The gap between third and 12th grade is 20.7 percentage points. A senior in the statewide data was therefore almost three times as likely to meet the chronic absenteeism threshold as a third grader. Indiana also reported that every grade improved compared with 2023–24.
A 1.3 Million-Student Sample Shows a Similar Grade Pattern
A separate SchoolStatus 2024–25 Attendance Trends Report analyzed attendance records for about 1.3 million students across 172 districts in ten states. These are participating districts rather than a nationally representative sample, but the grade progression closely resembles the pattern in official state data.
| Grade | Chronic Absenteeism Rate |
|---|---|
| Pre-K | 27.85% |
| Kindergarten | 23.50% |
| Grade 1 | 17.50% |
| Grade 3 | 15.24% |
| Grade 5 | 14.22% |
| Grade 6 | 17.54% |
| Grade 8 | 22.31% |
| Grade 10 | 26.60% |
| Grade 12 | 32.13% |
In this dataset, chronic absenteeism declines through the elementary years and bottoms out around fifth grade at 14.22%. It then climbs through every stage shown in the report, reaching 22.31% in eighth grade, 26.60% in 10th grade, and 32.13% in 12th grade.
The fifth-to-12th-grade difference is 17.91 percentage points. The senior rate is about 2.3 times the fifth-grade rate. The report also found improvement from 2023–24 in several elementary and middle grades, while the 12th-grade rate moved slightly upward from 31.89% to 32.13%.
Where the Grade-Level Curve Changes
The available 2024–25 data show three broad stages. Kindergarten starts above the rates seen in most elementary grades. Rates then fall as students move through the early elementary years and tend to reach their lowest point around grades 3–5.
The direction changes around the transition into middle school. Both the Indiana statewide data and the multi-state district sample show rates increasing from sixth grade onward. The rise becomes larger during high school, with the highest rate appearing in 12th grade in both datasets.
10.9%
Grade 3 in 2024–25
31.6%
Grade 12 in 2024–25
Connecticut Data Points in the Same Direction
Connecticut’s official 2024–25 results provide another state-level check. The Connecticut State Department of Education reported a 16.3% chronic absenteeism rate for kindergarten, while grades 3 and 4 had the state’s lowest grade-level rates at 12.5% and 12.4%. The department also reported that high school absenteeism remained higher than in the lower grades.
Connecticut’s overall K–12 chronic absenteeism rate was 17.2% in 2024–25, down from 17.7% in 2023–24. The exact percentages differ from Indiana and the SchoolStatus sample, but the age pattern is similar: a higher rate at the beginning of schooling, lower rates during the elementary years, and higher absenteeism among older students.
Why Grade-Level Rates Differ Across Datasets
Chronic absenteeism is generally based on the share of enrolled school days a student misses rather than only unexcused absences. The federal Ed Data Express measure defines chronically absent students as students absent for 10% or more of school days during the school year.
State and local calculations can still differ in important details. Eligibility rules may determine how many enrollment days a student needs before being counted. States may also handle transfers, partial days, instructional time and suppressed data differently.
The SchoolStatus analysis tracks attendance by period or class and converts partial-day absences into accumulated absence time. The report notes that this method can produce higher absence measurements than state systems that rely mainly on full-day attendance records. Its rates should therefore be interpreted as results for the participating districts, not as official U.S. grade-level rates.
For comparisons across grades, the cleanest approach is to use grades from the same dataset, school year and calculation method. A difference between two states does not necessarily mean students in one state attend less often; part of the gap can come from reporting rules and the students included in the denominator.