NYC Chronic Absenteeism Fell Again in 2024–25
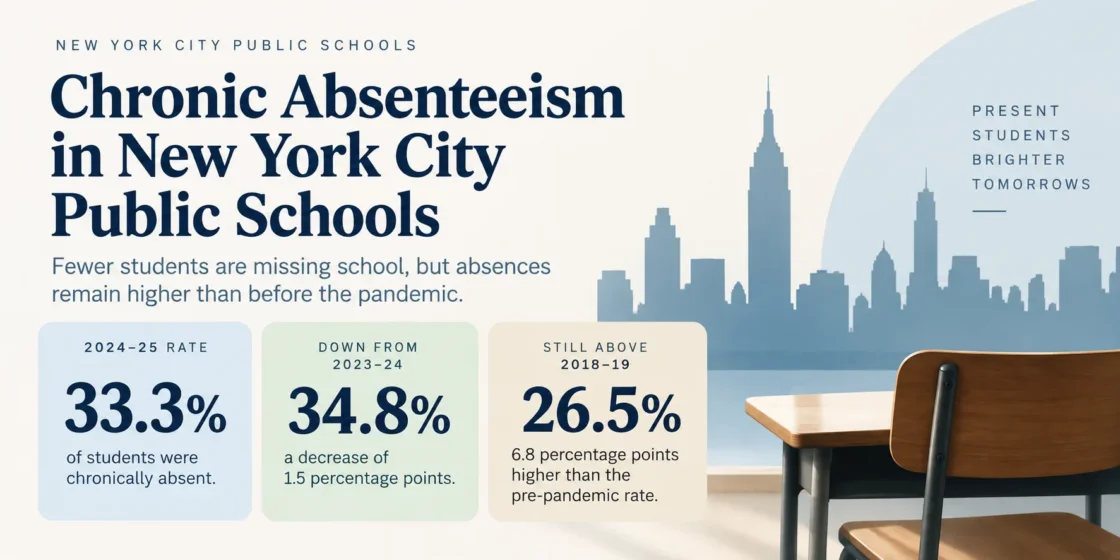
New York City Public Schools reported a chronic absenteeism rate of 33.3% for 2024–25. That was down from 34.8% in 2023–24 and well below the pandemic-era peak, but it remained 6.8 percentage points above the 2018–19 rate of 26.5%.
The decline means the city has continued to recover from the sharp rise in missed school that followed the start of the COVID-19 pandemic. The recovery is not complete. About one-third of students still met the chronic-absence threshold in 2024–25.
The comparable series shows the pre-pandemic level, the pandemic-era peak, and the decline through 2024–25.
NYC Public Schools End-of-Year Attendance and Chronic Absenteeism data are used for the series. The 2019–20 year is omitted because the attendance file covers only September 2019 through March 13, 2020. The 2020–21 measure includes both in-person and remote attendance.
| School Year | Chronic Absenteeism Rate | Reporting Context |
|---|---|---|
| 2018–19 | 26.5% | Pre-pandemic comparison year |
| 2020–21 | 29.7% | In-person and remote attendance included |
| 2021–22 | 40.2% | Highest rate in the series shown |
| 2022–23 | 36.2% | Rate began moving down from the peak |
| 2023–24 | 34.8% | Continued decline |
| 2024–25 | 33.3% | Latest citywide year reported |
From the 2021–22 peak to 2024–25, the rate fell by 6.9 percentage points. The latest rate was also 1.5 percentage points lower than in 2023–24. Even after those declines, the gap from 2018–19 was almost as large as the improvement since the peak.
NYC Public Schools reported 906,248 students and 1,597 NYCPS schools for 2024–25. Charter-school enrollment is reported separately, and charter schools are not part of the NYCPS end-of-year attendance dataset used for the chronic-absence figures on this page.
The Citywide Rate Masks Large Differences Between Student Groups
A citywide rate of 33.3% does not describe every student population equally. The 2024–25 data show gaps of more than 20 percentage points between some racial and ethnic groups, while students experiencing housing instability had still higher rates.
Chronic Absenteeism by Race and Ethnicity
The citywide rate is included as a reference point rather than as a racial or ethnic category.
| Student Group | Chronic Absenteeism Rate | Difference From Citywide Rate |
|---|---|---|
| Asian | 21.3% | −12.0 pp |
| White | 21.6% | −11.7 pp |
| All students | 33.3% | — |
| Hispanic | 40.7% | +7.4 pp |
| Black | 41.7% | +8.4 pp |
The Black student rate was 20.4 percentage points higher than the Asian student rate in 2024–25. These differences describe attendance outcomes; they do not show that race or ethnicity itself caused an absence. Housing conditions, economic circumstances, health, transportation, school experience, disability status, and other factors can overlap within the same student populations.
Temporary Housing and Shelter Rates Remain Much Higher
Housing status reveals an even wider attendance divide. More than 154,000 New York City public school students experienced homelessness during 2024–25, or close to one in seven students. About 42% of those students spent time in a City shelter, while about 53% were living doubled up with other people because of housing loss or economic hardship, according to enrollment data analyzed by Advocates for Children of New York.
| Student Population | Chronic Absenteeism | Context |
|---|---|---|
| All NYCPS students | 33.3% | Citywide rate |
| Students in temporary housing | Nearly half | Includes several forms of temporary housing |
| Students living in shelter | 63% | Subset of students in temporary housing |
Advocates for Children of New York reported the temporary-housing and shelter figures using 2024–25 data obtained from NYCPS. Students in temporary housing collectively missed at least 1.1 million days of instruction during the year. The shelter figure should not be added to the temporary-housing figure because students living in shelter are already part of the broader temporary-housing population.
The data identify a strong attendance disparity, but they do not assign one reason to every missed day. Students experiencing homelessness may face different combinations of residential moves, transportation barriers, health needs, family disruption, or other circumstances.
Kindergarten Absence Remains Above the Pre-Pandemic Level
Chronic absenteeism is not confined to middle and high school. In 2024–25, 37.8% of NYC kindergarten students were chronically absent. The rate was lower than the 40.7% recorded in 2023–24, but it remained above the 31.3% reported for 2018–19.
| School Year | Kindergarten Rate | Change From 2018–19 |
|---|---|---|
| 2018–19 | 31.3% | — |
| 2023–24 | 40.7% | +9.4 pp |
| 2024–25 | 37.8% | +6.5 pp |
The latest kindergarten rate fell 2.9 percentage points in one year. Its level still matters because a chronic-absence measure captures repeated loss of instructional time even in grades where missed school is sometimes viewed as less consequential than absence in high school.
NYCPS Uses Attendance Teams, School Avoidance Liaisons, and Individual Plans
Current NYCPS attendance guidance identifies several school-based contacts for students with recurring attendance problems. Depending on the situation, support can involve a Parent Coordinator, counselor, school avoidance liaison, or attendance team. A school and family may also develop a Student Attendance Success Plan tailored to the barriers affecting that student.
- Attendance notification: schools are expected to contact families when a student is absent or late.
- School avoidance support: a school avoidance liaison can work with students whose attendance problems involve difficulty attending or remaining in school.
- Attendance team review: school staff can examine recurring attendance patterns and coordinate support.
- Student Attendance Success Plan: the plan can identify attendance goals, barriers, responsible adults, and supports.
- Related services: NYCPS guidance points families toward help involving transportation, housing, food, health care, mental health, mentoring, counseling, and school engagement when those needs affect attendance.
NYCPS states that there is no general remote-learning option for the current school year. Remote attendance is limited to designated virtual programs, medically necessary instruction, and certain emergency building closures or other approved situations.
These supports address attendance barriers; they do not change how chronic absenteeism is measured. A student can still reach the chronic-absence threshold even when missed days have an accepted explanation.
What Counts as Chronic Absence in NYCPS Data
NYCPS chronic absenteeism reporting identifies students who miss at least 10% of the instructional days for which they are enrolled. In a 180-day enrollment period, 10% equals 18 missed days, but the measure is not a fixed 18-day rule for every student.
Excused absences still count as absences in the attendance record. NYCPS states that a student who is not in school must be marked absent even when the absence is excused for a medical reason, religious observance, emergency, or another accepted reason.
That makes chronic absenteeism different from truancy. Chronic absenteeism measures missed instructional time without limiting the calculation to unexcused absences. Truancy is tied to attendance rules and the treatment of unexcused absence under state or local requirements.
City, Borough, District, and School Rates Are Calculated Separately
NYCPS publishes end-of-year attendance data at the citywide, borough, community school district, and school levels. The files also include student characteristics such as disability status, race and ethnicity, poverty status, English learner status, and temporary housing status when reporting rules allow the data to be shown.
The district files cover geographic Community School Districts 1 through 32 as well as District 75. The attendance dataset does not include charter schools, District 79, homeschooling, or home and hospital instruction in the same reporting population.
A student who transfers during the year may contribute to records for more than one school. NYCPS recalculates and deduplicates students within district, borough, and citywide reporting levels, so summing school-level chronic-absence counts can overstate the total.
This distinction also explains why the 33.3% citywide rate should not be treated as the average of individual school percentages. Schools differ in enrollment size, and higher geographic levels are calculated from student records rather than by averaging the percentages shown for each school.
Two Reporting Boundaries Affect Year-to-Year Comparisons
The 2019–20 school year is unusual because NYCPS’s end-of-year attendance file covers attendance only through March 13, 2020. It should not be treated as a normal full-year observation beside later years. For 2020–21, the attendance measure includes both in-person and remote attendance, reflecting the operating conditions of that school year.
NYCPS also moved to the New York State Education Department chronic-absence definition beginning with 2020–21 and applied that definition to earlier years in its published historical file to improve comparability.
New York State Education Department reporting guidance changes the minimum enrollment requirement for chronic-absence eligibility from at least 10 cumulative instructional days to at least 30 beginning with 2025–26, while retaining the requirement that the student attend at least one day. Comparisons that cross this boundary should account for the change in the reporting population.
NYCPS also applies privacy suppression to small groups in its public attendance files. A blank or suppressed subgroup value therefore should not be interpreted as a zero rate, and suppressed values should not be estimated from nearby rows.