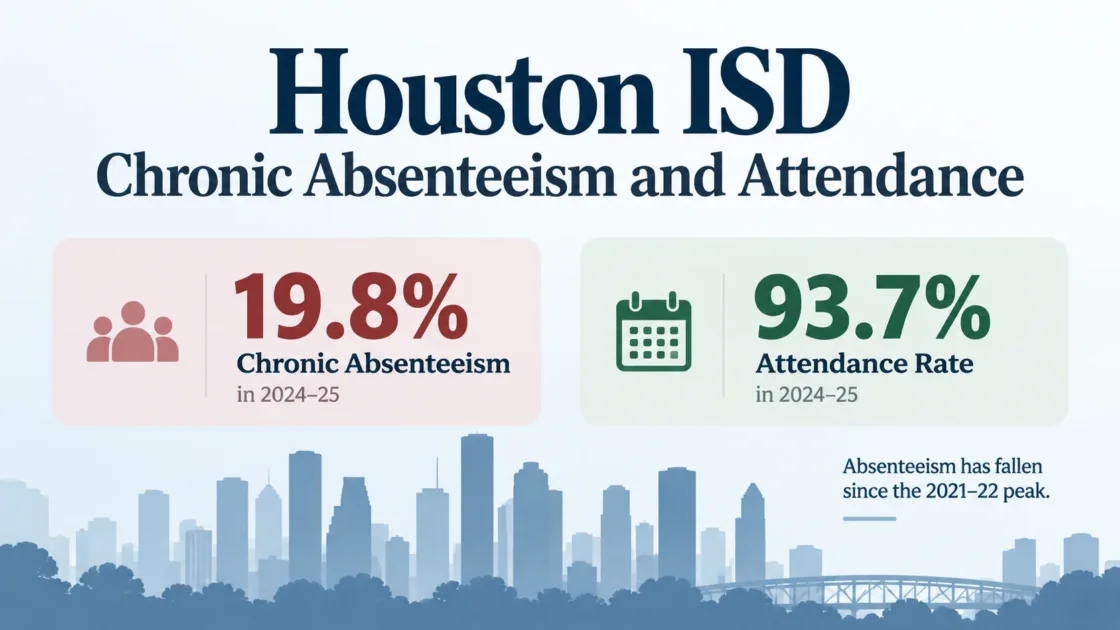
Houston ISD’s newest Texas Education Agency TPRS attendance data show a 19.8% chronic absenteeism rate and a 93.7% attendance rate for 2024–25. Chronic absenteeism fell from 20.4% in 2023–24, but Houston ISD remained above both the Texas rate of 18.0% and the Region 04 rate of 17.8%.1
Houston ISD Chronic Absenteeism Has Fallen Since the 2021–22 Peak
Houston ISD’s chronic absenteeism rate rose to 27.5% in 2021–22 and then declined in each of the next three reported school years. By 2024–25, the rate had fallen to 19.8%, a decrease of 7.7 percentage points from the 2021–22 peak.
| School Year | HISD Chronic Absenteeism | Texas Chronic Absenteeism | Region 04 Chronic Absenteeism | HISD Attendance Rate |
|---|---|---|---|---|
| 2020–21 | 20.2% | 15.0% | 15.4% | 93.7% |
| 2021–22 | 27.5% | 25.7% | 24.1% | 91.9% |
| 2022–23 | 22.3% | 20.3% | 20.0% | 93.0% |
| 2023–24 | 20.4% | 19.0% | 18.3% | 93.5% |
| 2024–25 | 19.8% | 18.0% | 17.8% | 93.7% |
The district rate peaked in 2021–22 and declined in each of the next three reported years.
Rates are TEA TPRS values for the school years shown.
The district’s attendance rate moved in the opposite direction after 2021–22, rising from 91.9% to 93.7% by 2024–25. The chronic-absence gap between Houston ISD and Texas also narrowed, although HISD remained 1.8 percentage points above the statewide rate in 2024–25 and 2.0 points above Region 04.
A 93.7% Attendance Rate Can Coexist With 19.8% Chronic Absenteeism
The two percentages measure different things. Houston ISD can therefore report a high overall attendance rate while a much larger share of individual students meet the chronic-absence reporting threshold.
93.7%
Describes attendance across the district’s reported instructional time.
19.8%
Describes the share of students who met the chronic-absence reporting criteria.
An attendance rate is an aggregate measure. Chronic absenteeism is student-based: it identifies students whose individual absence pattern crosses the applicable threshold. A district average can remain above 93% even when close to one in five students are classified as chronically absent.
The TPRS attendance table reports Houston ISD’s chronic absenteeism rate but does not present an official chronic-absent student count beside that rate. Applying 19.8% to a separate general enrollment figure would mix reporting populations and should not be presented as an official TEA count.1
Chronic Absenteeism Varies Widely Across HISD Student Groups
The districtwide rate does not describe every student population equally. TEA’s 2024–25 TPRS data show rates ranging from 7.7% for White students and 7.8% for Asian students to 28.6% for African American students. Program and economic-status groups also show differences from the district average.1
| Student Group | 2023–24 | 2024–25 | Change |
|---|---|---|---|
| Houston ISD | 20.4% | 19.8% | −0.6 pp |
| African American | 30.2% | 28.6% | −1.6 pp |
| Hispanic | 20.3% | 20.1% | −0.2 pp |
| White | 8.1% | 7.7% | −0.4 pp |
| American Indian | 21.1% | 23.4% | +2.3 pp |
| Asian | 7.4% | 7.8% | +0.4 pp |
| Pacific Islander | 22.8% | 21.1% | −1.7 pp |
| Two or More Races | 13.0% | 13.3% | +0.3 pp |
| Special Education | 26.8% | 25.1% | −1.7 pp |
| Economically Disadvantaged | 23.0% | 22.6% | −0.4 pp |
| Emergent Bilingual / English Learner | 19.2% | 20.5% | +1.3 pp |
The chart uses the same TEA values reported in the student-group table.
African American students had a 28.6% chronic absenteeism rate in 2024–25, 8.8 percentage points above the district rate. The rates for students receiving special education services and economically disadvantaged students were 25.1% and 22.6%, respectively.
The year-to-year direction was not uniform across groups. Houston ISD’s overall rate declined by 0.6 percentage points, while the Emergent Bilingual / English Learner rate rose from 19.2% to 20.5%. The table shows differences in reported attendance outcomes; it does not by itself establish why those differences occurred.
The District Average Does Not Describe Every HISD Campus
School-level TEA reports show that chronic absenteeism can differ sharply from the 19.8% district average. The campuses below are selected examples from different school levels, not a ranking or a complete list of Houston ISD schools.
| Campus | School Level | Attendance Rate | Chronic Absenteeism |
|---|---|---|---|
| West University Elementary School4 | Elementary | 96.7% | 1.5% |
| Pershing Middle School5 | Middle | 93.8% | 19.7% |
| Wheatley High School6 | High | 89.4% | 47.6% |
Pershing Middle School was close to the districtwide chronic absenteeism rate, while the other two examples were far below or above it. Campus percentages should therefore be checked directly when the question concerns a particular school. A campus rate alone also does not identify the reasons students were absent or provide a general measure of school quality.
How HISD Records Daily and Class-Period Attendance
Houston ISD’s attendance policy uses instructional-time thresholds when determining whether a student is recorded as present. It also establishes timelines for absence documentation and parent notification.7
| Attendance Item | HISD Policy |
|---|---|
| Half-day presence | At least 2 hours of instructional attendance |
| Full-day presence | At least 4 hours of instructional attendance |
| Regular class period | At least 35 minutes present |
| 90-minute class period | At least 60 minutes present |
| Written absence excuse | Submitted within 3 school days after the student returns |
| Parent or guardian contact | The school attempts notification when a student has 3 absences |
For the daily attendance thresholds, instructional time does not include lunch, homeroom, passing periods, or other non-instructional time. HISD also states that unexcused tardies are not converted into unexcused absences, although tardiness may be addressed separately under district rules.
Texas’s Chronic Absenteeism Definition Changed After the 2024–25 Data Year
Texas Senate Bill 991 took effect on September 1, 2025.8 Texas Education Agency guidance issued under the law defines a chronically absent student using a threshold of more than 10% of required instructional days during a school year or during an enrollment period longer than 30 instructional days.9
For an enrollment period longer than 30 instructional days, chronic absenteeism applies when counted absences exceed 10% of the required instructional days. A student enrolled for 30 instructional days or fewer does not meet the statutory chronic-absence definition for that enrollment period. TEA guidance also excludes certain absences that qualify for state-funded attendance exceptions from the calculation.9
Houston ISD’s 19.8% figure is TEA’s published TPRS value for 2024–25.1 SB 991 became effective after that school year, so the later statutory definition should not be applied retroactively to replace TEA’s published historical rate.
The 90% Class-Credit Rule Measures Something Different
Texas Education Code Section 25.092 generally requires a student to attend at least 90% of the days a class is offered to receive credit or a final grade. A student attending at least 75% but less than 90% may be able to satisfy the requirement through a principal-approved plan, subject to the statute and local implementation.10
The 90% rule should not be used as the definition of chronic absenteeism. Chronic absenteeism is a student absence measure, while Section 25.092 addresses attendance for course credit or a final grade. Truancy is also a separate legal and administrative concept tied to qualifying unexcused absences.
HISD’s 2025–26 Plan Set a Five-Point Chronic-Absence Reduction Target
Houston ISD’s 2025–26 District Improvement Plan set a goal of reducing the percentage of chronically absent students by 5 percentage points compared with 2024–25. The same plan set an Average Daily Attendance target of 95%, up from a stated 2024–25 baseline of 93.2%.11
| Measure | Plan Baseline or Reference | 2025–26 Target |
|---|---|---|
| Chronic absenteeism | 2024–25 rate used as the comparison year | Reduce by 5 percentage points |
| Average Daily Attendance | 93.2% | 95.0% |
These figures are plan targets rather than final attendance outcomes. They should not replace later reported data when final results for the same measures are available.
The District Improvement Plan gives a 2024–25 Average Daily Attendance baseline of 93.2%, while TEA’s 2024–25 TPRS page reports a 93.7% Houston ISD attendance rate.111 Because the documents use different metric labels and reporting contexts, the two percentages should not be treated as interchangeable.